Skip to content

Dataset & benchmark · vehicle type from motion · IEEE IV 2027, in submission

VTTReading Vehicle Size and Powertrain from Motion

Sixty seconds of how a car moves — speed, pedals, steering, yaw, the gap to the car ahead — carry a readable signature of what is moving. On car models never seen in training, powertrain (BEV vs ICE) reads at 93.0 drive-level macro-F1; size stays at 67.1, and zero-training ceiling analyses say why.

VTT is a trajectory + CAN dataset at 10 Hz: 9,062 drives, 3,949.8 hours, 1,431 pseudonymous vehicles, 174 car models and 201,390 eligible 60-s windows, each drive labelled with its platform's footprint size class (SMALL / MID / LARGE; cuts 4.43 / 4.88 m²) and powertrain (ICE / HEV / PHEV / BEV). The headline split holds out 41 car models; four sequence architectures, feature baselines, a pre-registered method campaign and an episode-centric multiple-instance model are scored under window-, drive- and vehicle-level protocols.

IEEE IV 2027 · in submission · draft PDF41 held-out car models · 3 seeds · cluster-bootstrap CICC BY 4.0 · gated, manual approval

Yuhang Wang1·Yuechen Guo·Jingxin Yang·Chuheng Wei·Suyang Chen·Abdulaziz Alhuraish·Yiyi Wang·Jingran Sun·Hao Zhou

1University of South Florida · MOTIF-Lab

● REC
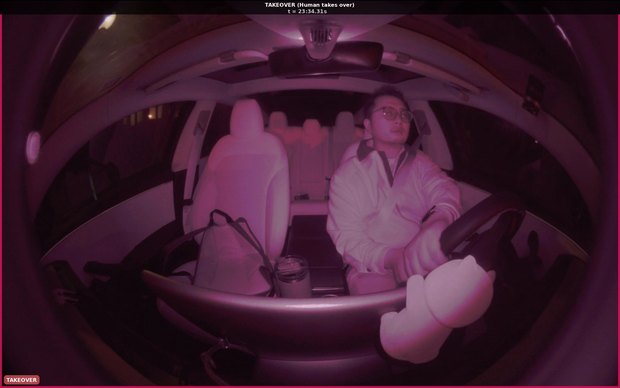
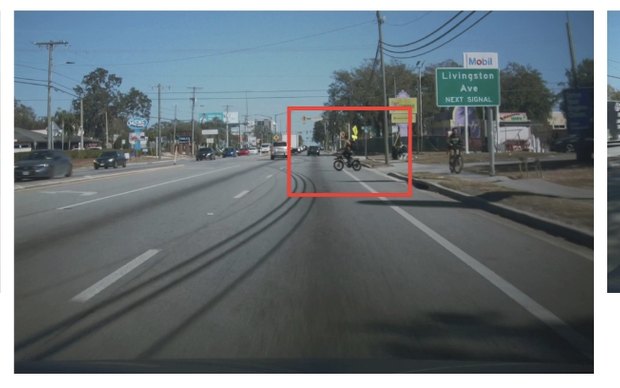
Forward camera of a held-out Tesla Model Y drive in city traffic
live · Tesla Model Y · drive_309083read BEV 0.93 · true BEV

201,390 eligible 60-s windows (600 consecutive samples, no gap, at least 20 % moving); 41 car models are held out as the headline test split (split_platform), and 62.6 % of all samples show driving automation system (DAS) activity, kept and labelled per sample. Dataset numbers follow the release-v1 card; benchmark numbers follow experiments/RESULTS.md of the code repository. The paper is in submission; the draft on this page may change.

01 · OVERVIEW

Can you tell what kind of vehicle produced a trace from how it moves?

The question, the release and the headline result, beside what you need at a glance.

From 60-s windows of trajectory and CAN signals — speed, acceleration, steering angle, rate and normalised torque, yaw rate, curvature, lateral acceleration, pedal flags, the automation flag and the lead vehicle's distance, relative speed, acceleration, headway and time to collision — we ask whether a vehicle's size class and powertrain type can be inferred for car models never seen in training. VTT releases 9,062 drives (3,949.8 h) from 1,431 pseudonymous vehicles and 174 car models with model-disjoint and device-disjoint splits and window-, drive- and vehicle-level protocols; benchmarks four sequence architectures (1-D ResNet, bi-GRU, Transformer, bidirectional Mamba-2), hand-crafted statistics and LLM-proposed physical features under those protocols; and then runs a pre-registered method campaign on model-disjoint internal folds — car-model-balanced sampling, auxiliary physical targets, physics-safe augmentation, DAS down-weighting and an episode-centric multiple-instance model.

On the 41 held-out car models, BEV vs ICE reaches 92.6–93.0 drive-level macro-F1 (vehicle level 92.8–93.4); size, three footprint classes, improves from 62.9 to 67.1 at drive level but stays far from 90. Zero-training oracle analyses — a per-car-model majority oracle, a footprint-noise oracle, a curb-mass oracle, evidence sufficiency and the separability of the held-out models — indicate that the size gap is set by the label resolution and the composition of the training fleet rather than by model capacity or the evidence available per drive.

02 · EXPLORE

One drive, three windows, one read-out per minute

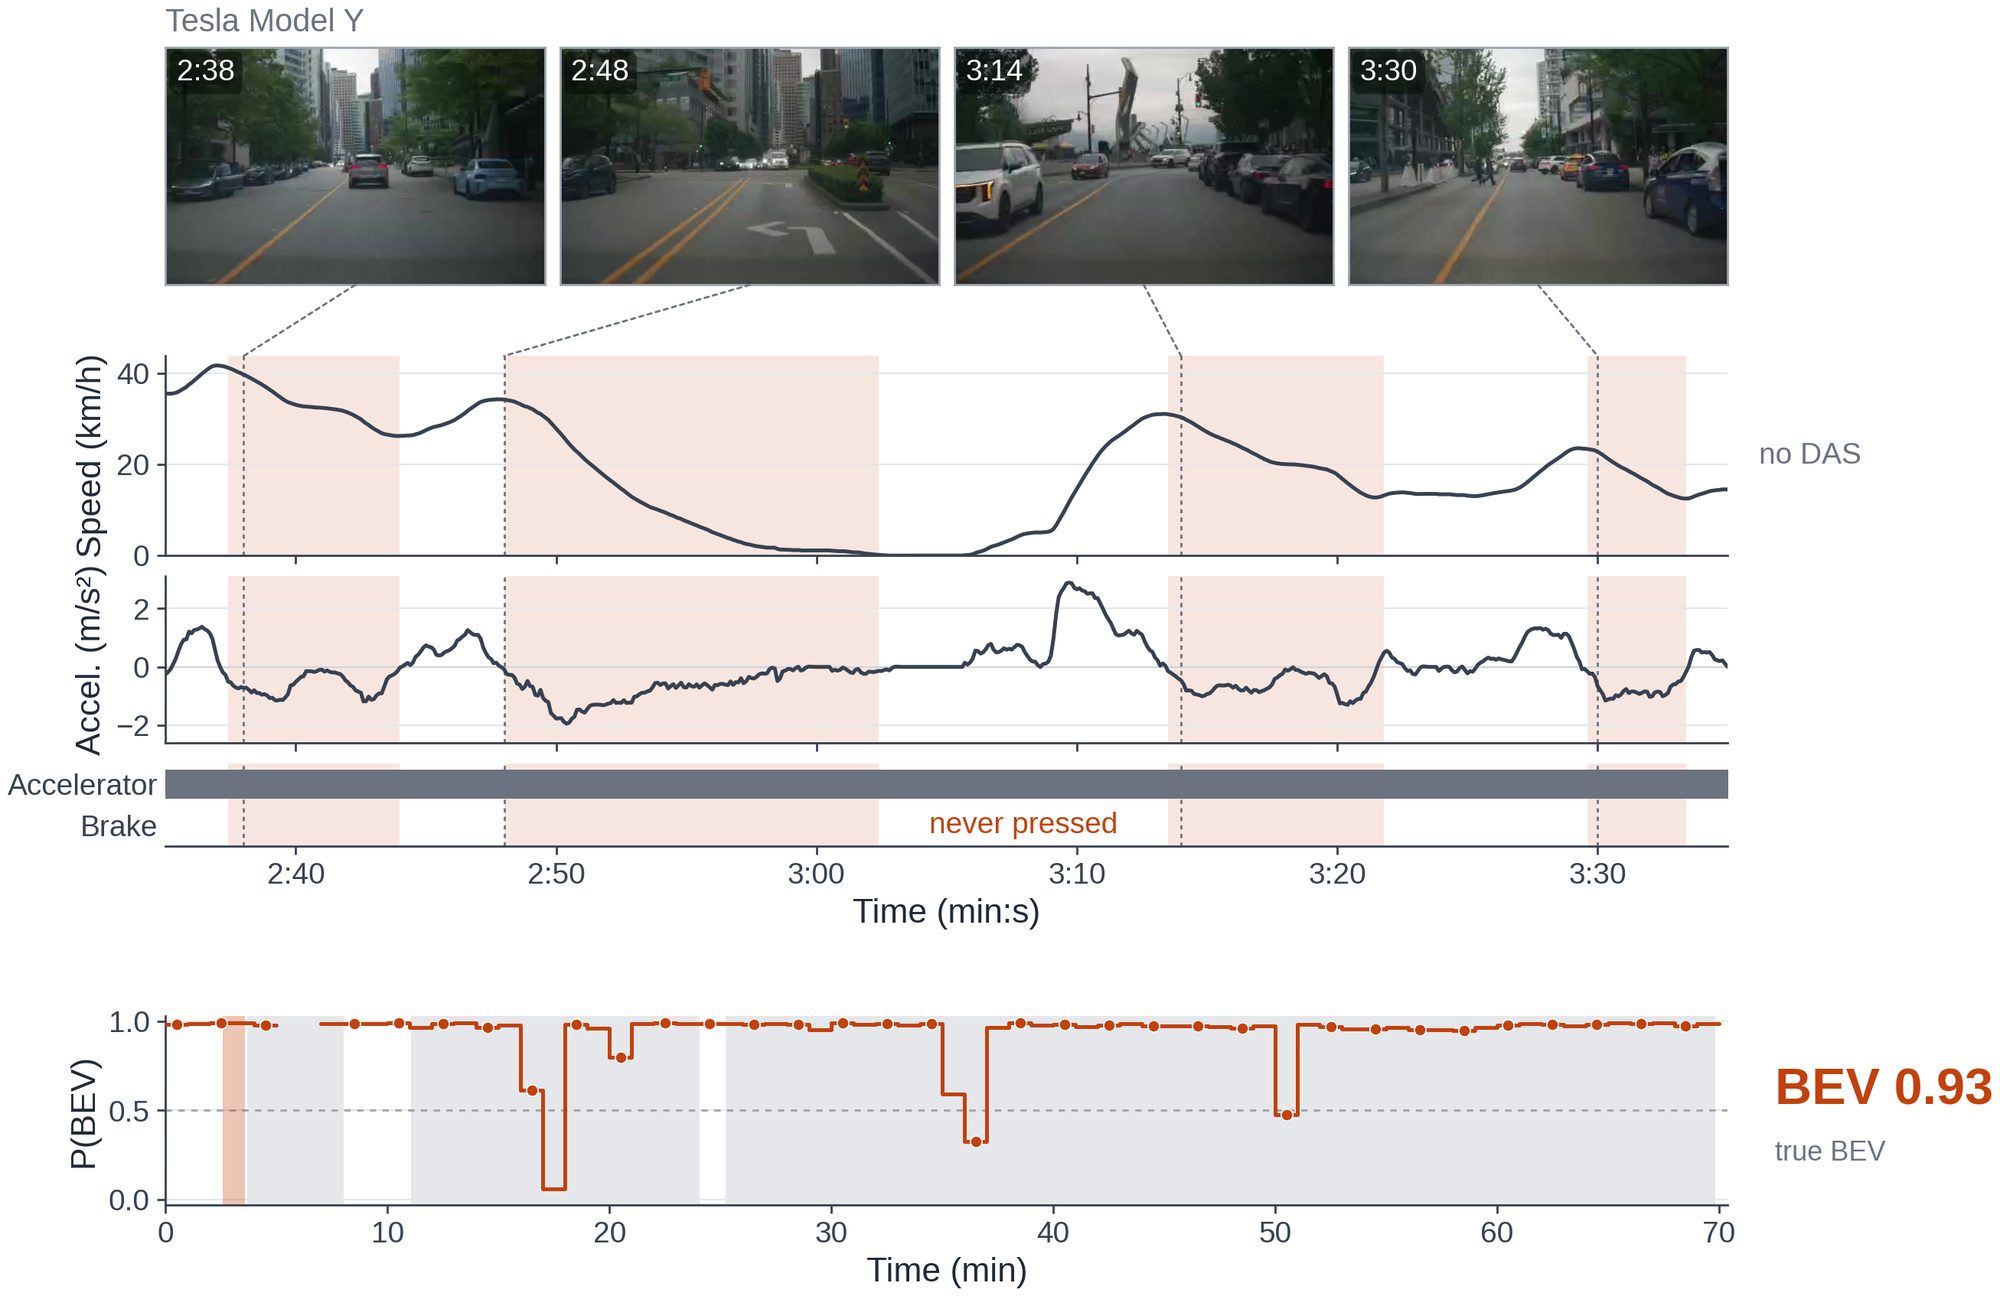
A held-out Tesla Model Y in city traffic (drive_309083, a public pseudonym), minutes 1:00–4:00 of the drive: forward camera and the 10 Hz drive table on one clock. The shaded stretches mark DAS activity; the gold markers are lift-off decelerations with the brake not pressed; the step trace is the 1-D ResNet B5 window probability of BEV, drawn at the end of each 60-s window.

● REC
Four stills of lift-off decelerations in one human-driven city minute of a Tesla Model Y, with speed, acceleration, pedal lanes and the whole-drive P(BEV) track
Static view. Lift-off decelerations in one human-driven minute; brake never pressed; whole-drive P(BEV) track (demo figure).

Whole-drive ribbon

Timeline unavailable.

Upper lane: DAS activity per 60-s window across the whole drive. Lower lane: the read-out of every scored window — BEV in the page accent, ICE in coral. The two marks bracket the three minutes played above; clicking between them seeks the explorer (outside them the clip snaps to its nearest end).

Six case drives, all held-out car models

Pick a case. Each clip is a forward-camera excerpt of a test drive with its 10 Hz signals; the step traces are the final window models' read-outs, one value per 60-s window at the window end: P(BEV) from the 1-D ResNet B5 (seed 1) on every case, and for the two size cases also P(LARGE) and P(SMALL) from the bi-GRU S9 (seed 0). Titles give the drive-level decision and the true class.

● REC
Same Tesla Model S, two drives: a 92 percent automated drive read as ICE and a 40 percent automated drive read as BEV, with per-window shading
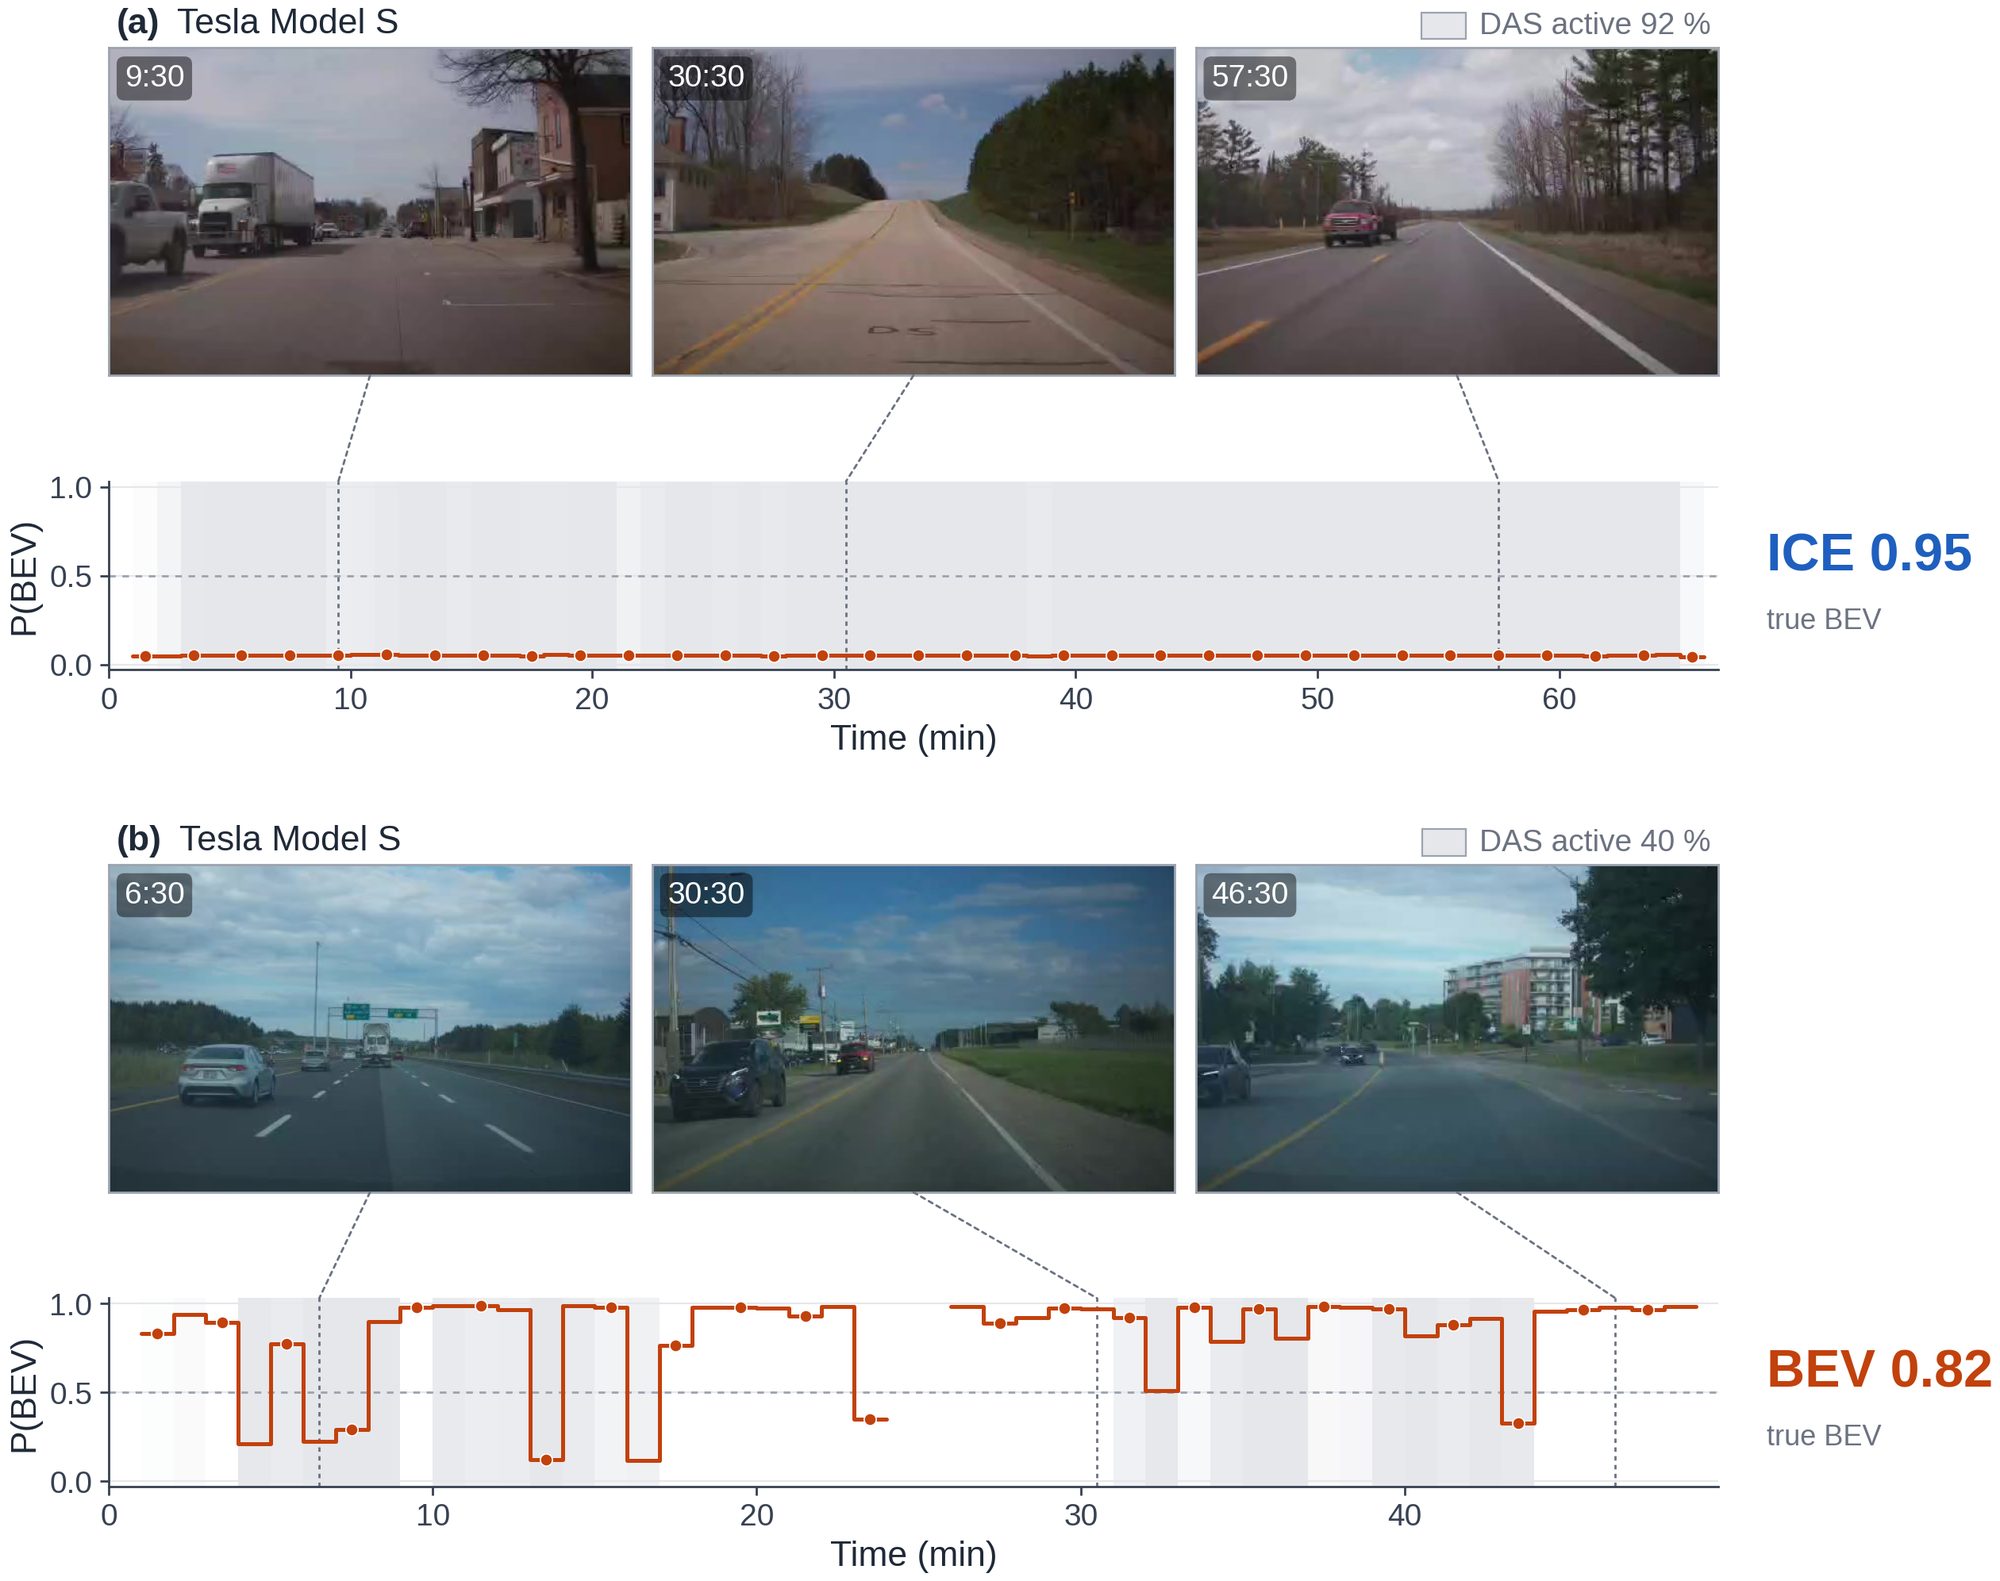
Static view. The same car model, two drives: automation share decides the read-out (demo figure).

Watch one window being judged

Window 2 of drive_309083 (2:00–3:00), played at 1.25×. Forward view advancing, speed and acceleration drawn progressively, pedal lanes; at the window end the 1-D ResNet B5 (seed 1) reads BEV 0.99 and the running drive mean stays at BEV 0.99.

What a window model sees

Only the 20 official channels of 600 consecutive 10 Hz samples — no brand, platform, region or software metadata, which are kept out of the inputs because they carry shortcuts. Here the car is human-driven (no DAS activity in the window or the 10 s before it): top speed 47 km/h, accelerations between −3.2 and +3.3 m/s², the accelerator pressed 85 % of the time and the brake 9 %.

A drive's decision is the mean of its windows' probability vectors followed by arg-max; the running mean along a drive is what the fleet-level tables score at drive level. Vehicle level pools all test drives of a pseudonymous vehicle the same way.
03 · EVIDENCE

What the numbers rest on

Headline split: 41 car models held out, three seeds, drive-level macro-F1 with a 95 % cluster bootstrap over car models. Results are reference points under a fixed protocol, not a leaderboard.

93.0 drive-level macro-F1 · BEV vs ICE · 41 held-out car models

Powertrain reads on car models never seen in training.

1-D ResNet with recipe B5: 93.0 drive-level macro-F1, 95 % CI [87.2, 96.6]; the bi-GRU B5 reaches 92.6 and, at vehicle level, 93.4. The reference recipes already sit at 88.4–91.1; the recipe adds 2–4 points. Bar = drive-level macro-F1, second value = window level.

Main results table below.
67.1 drive-level macro-F1 · size · from 62.9

Size improves with the recipe — and stays far from 90.

bi-GRU with recipe S9: 67.1 drive-level macro-F1 (CI [54.4, 74.2]) against 62.9 for the reference bi-GRU; window level stays at about 53.2. The four deep architectures lie within about two points of each other at window level and within three at drive level, so architecture is not the bottleneck; drive-level aggregation adds 7–9 points to the reference models and 14 with the recipe.

Main results table below.
92.1 size macro-F1 of a footprint oracle at σ = 0.10 m²

The size gap points to label resolution, not model capacity.

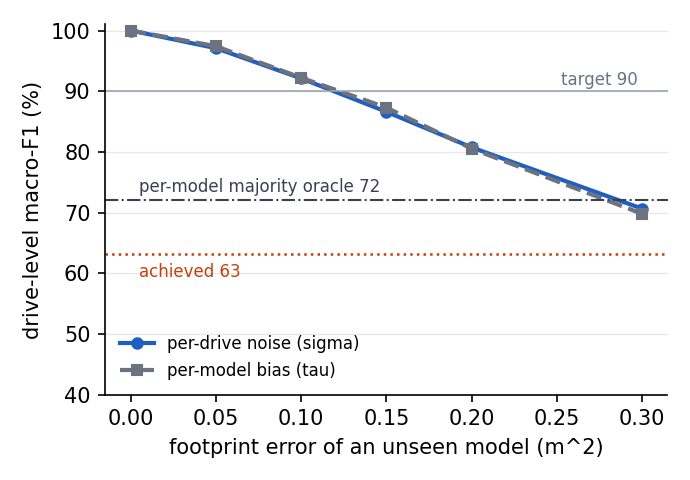
Give an oracle the true footprint plus per-drive noise and cut it at the thresholds: 92.1 at σ = 0.10 m², 86.6 at 0.15, 80.7 at 0.20 — reaching 90 needs an error of about ±0.12 m², roughly 2.5 % of a 4.6 m² footprint. 21 of the 41 held-out car models lie within 0.15 m² of a differently-labelled training model. A per-car-model majority oracle on the reference predictions scores 72.0; two curb-mass cuts fitted on the training drives score 63.3.

Footprint-noise oracle: size macro-F1 against the footprint noise, with the achieved and majority-oracle lines
Footprint-noise oracle (paper figure). Achieved 63.2 (reference ensemble), per-car-model majority oracle 72.0.
63.8–73.8 % size drive accuracy by windows per drive · flat

Evidence per drive is not the bottleneck either.

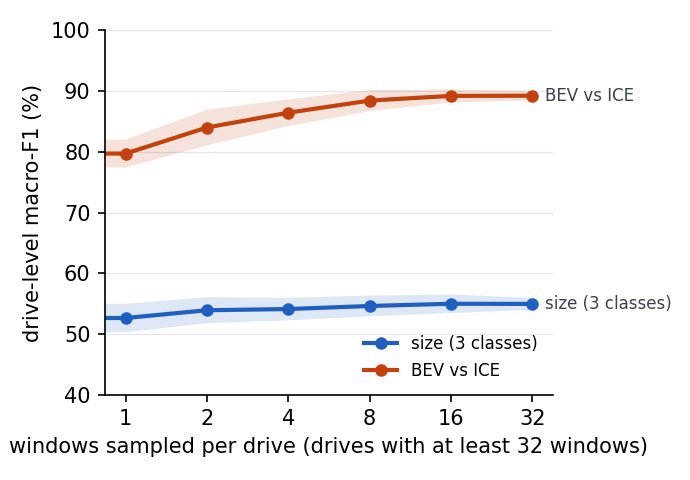
Drive accuracy by number of windows per drive stays between 63.8 and 73.8 % for size and 85.7 and 93.2 % for BEV vs ICE from 1–2 windows to more than 64. Subsampling m windows on drives with at least 32: size 52.6 → 54.9 macro-F1 from m = 1 to 32 (all windows 56.0); BEV vs ICE 79.7 → 89.3, saturating by 8–16 windows. Accuracy does not grow with the number of acceleration or deceleration episodes either.

Evidence sufficiency: drive-level macro-F1 against the number of windows sampled per drive for both tasks
Evidence sufficiency (paper figure). Drive-level macro-F1 against windows sampled per drive.
9,062 → 41 drives in the release · car models held out for the test

Scope, stated plainly.

The release: 9,062 drives, 3,949.8 nominal hours (3,078.1 moving), 1,431 pseudonymous vehicles on 360 platforms of 38 brands, 174 car models, 201,390 eligible 60-s windows. Hours per size class: SMALL 1,784 (44.7 %), MID 1,124 (28.1 %), LARGE 1,037 (25.9 %); eligible windows per powertrain: ICE 79,566, HEV 23,708, PHEV 10,585, BEV 64,968; platforms sold with several powertrains carry no powertrain label (11.1 % of the drives). In the headline scheme the identity group — same device, same vehicle identity or shared drive names — is the unit, 41 car models form the test split, and the validation split shares 53 of its 56 car models with training, so only the test split is model-disjoint. Chance level is about 33 for size and 50 for BEV vs ICE; 62.6 % of the samples show DAS activity, so part of every signature is the controller's.

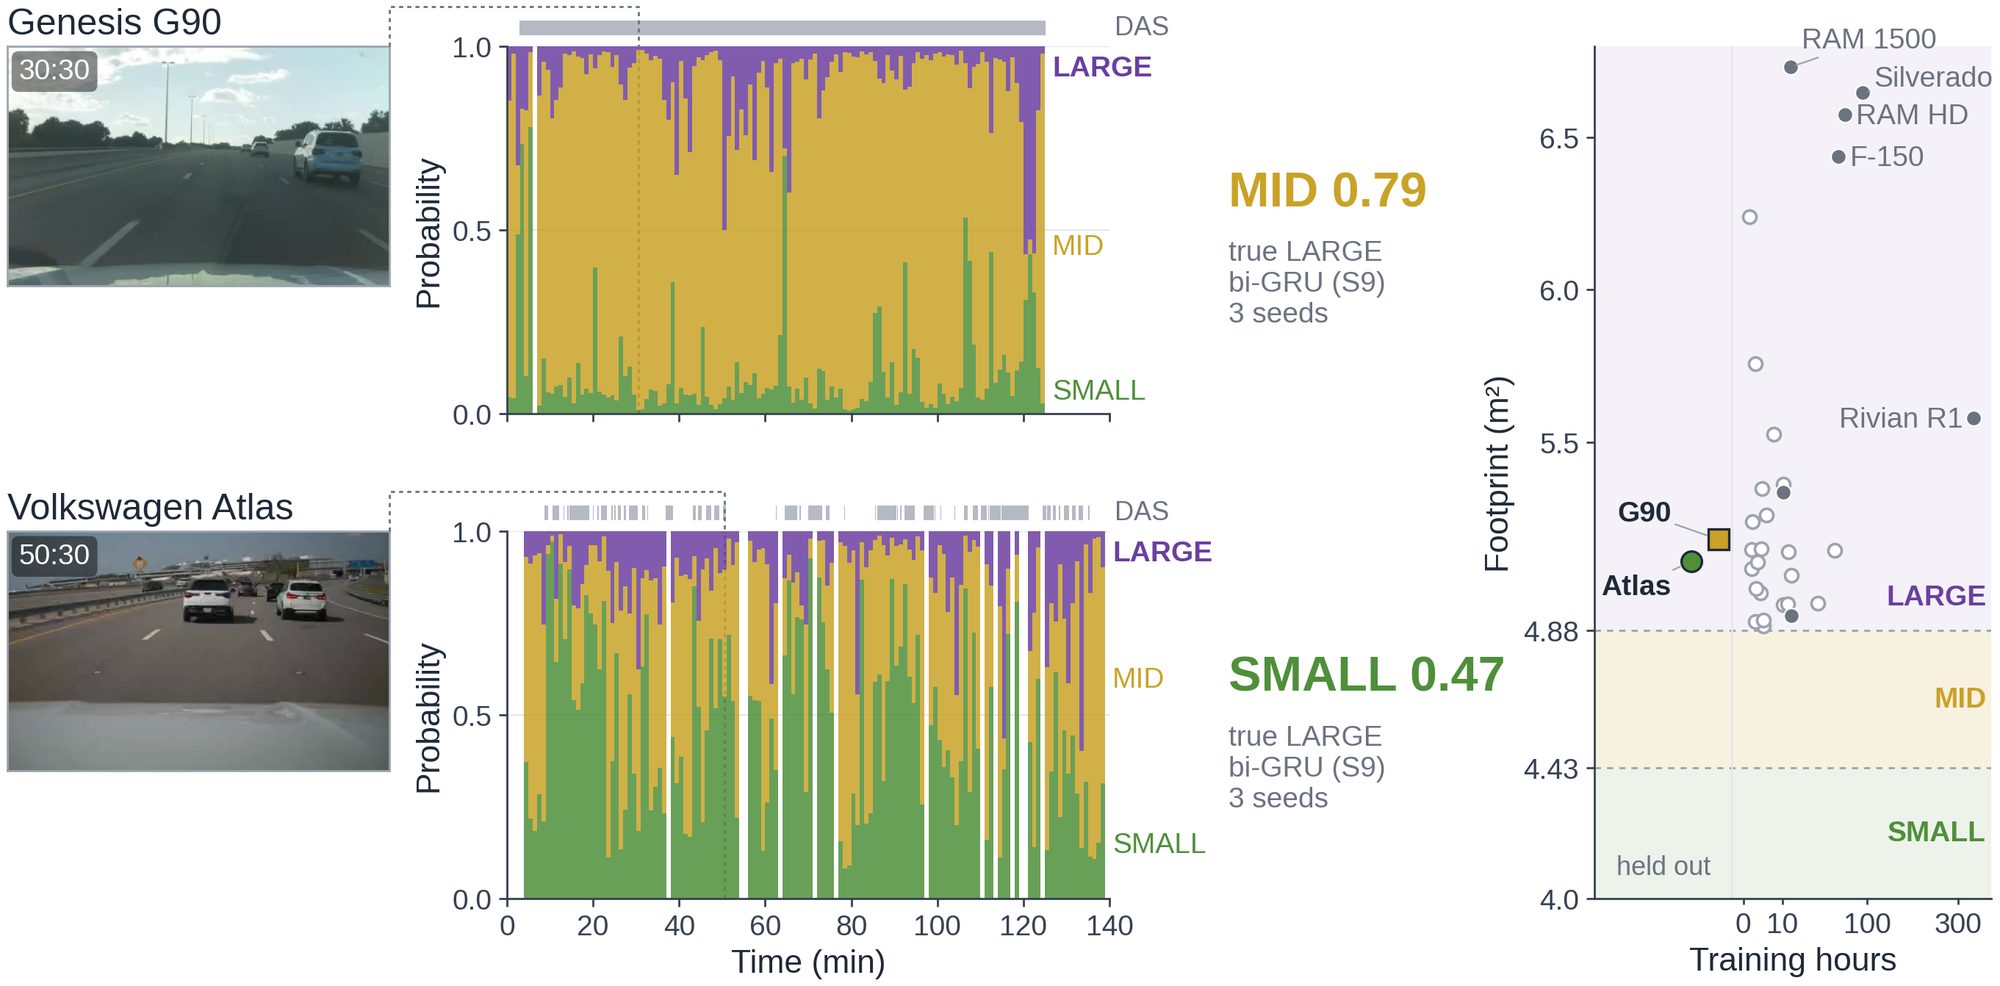
Large unibody cars read as MID or SMALL; the footprint panel shows LARGE training hours coming mostly from pickups
LARGE is learned as truck-like. Genesis G90 and Volkswagen Atlas (both LARGE, ICE) are read MID 0.79 and SMALL 0.47 by the bi-GRU S9 (3-seed mean); the LARGE training hours come mostly from pickups and body-on-frame SUVs (demo figure).

Per held-out car model: reference recipe → final recipe

One row per held-out car model; the dot pair is the share of the model's test drives decided correctly by the reference model (ResNet for BEV vs ICE, bi-GRU for size; mean of three seeds) and by the final recipe (ResNet B5 / bi-GRU S9; mean of three seeds). Models from the cases above are emphasised; the dashed line is chance. Switch task with the chips.

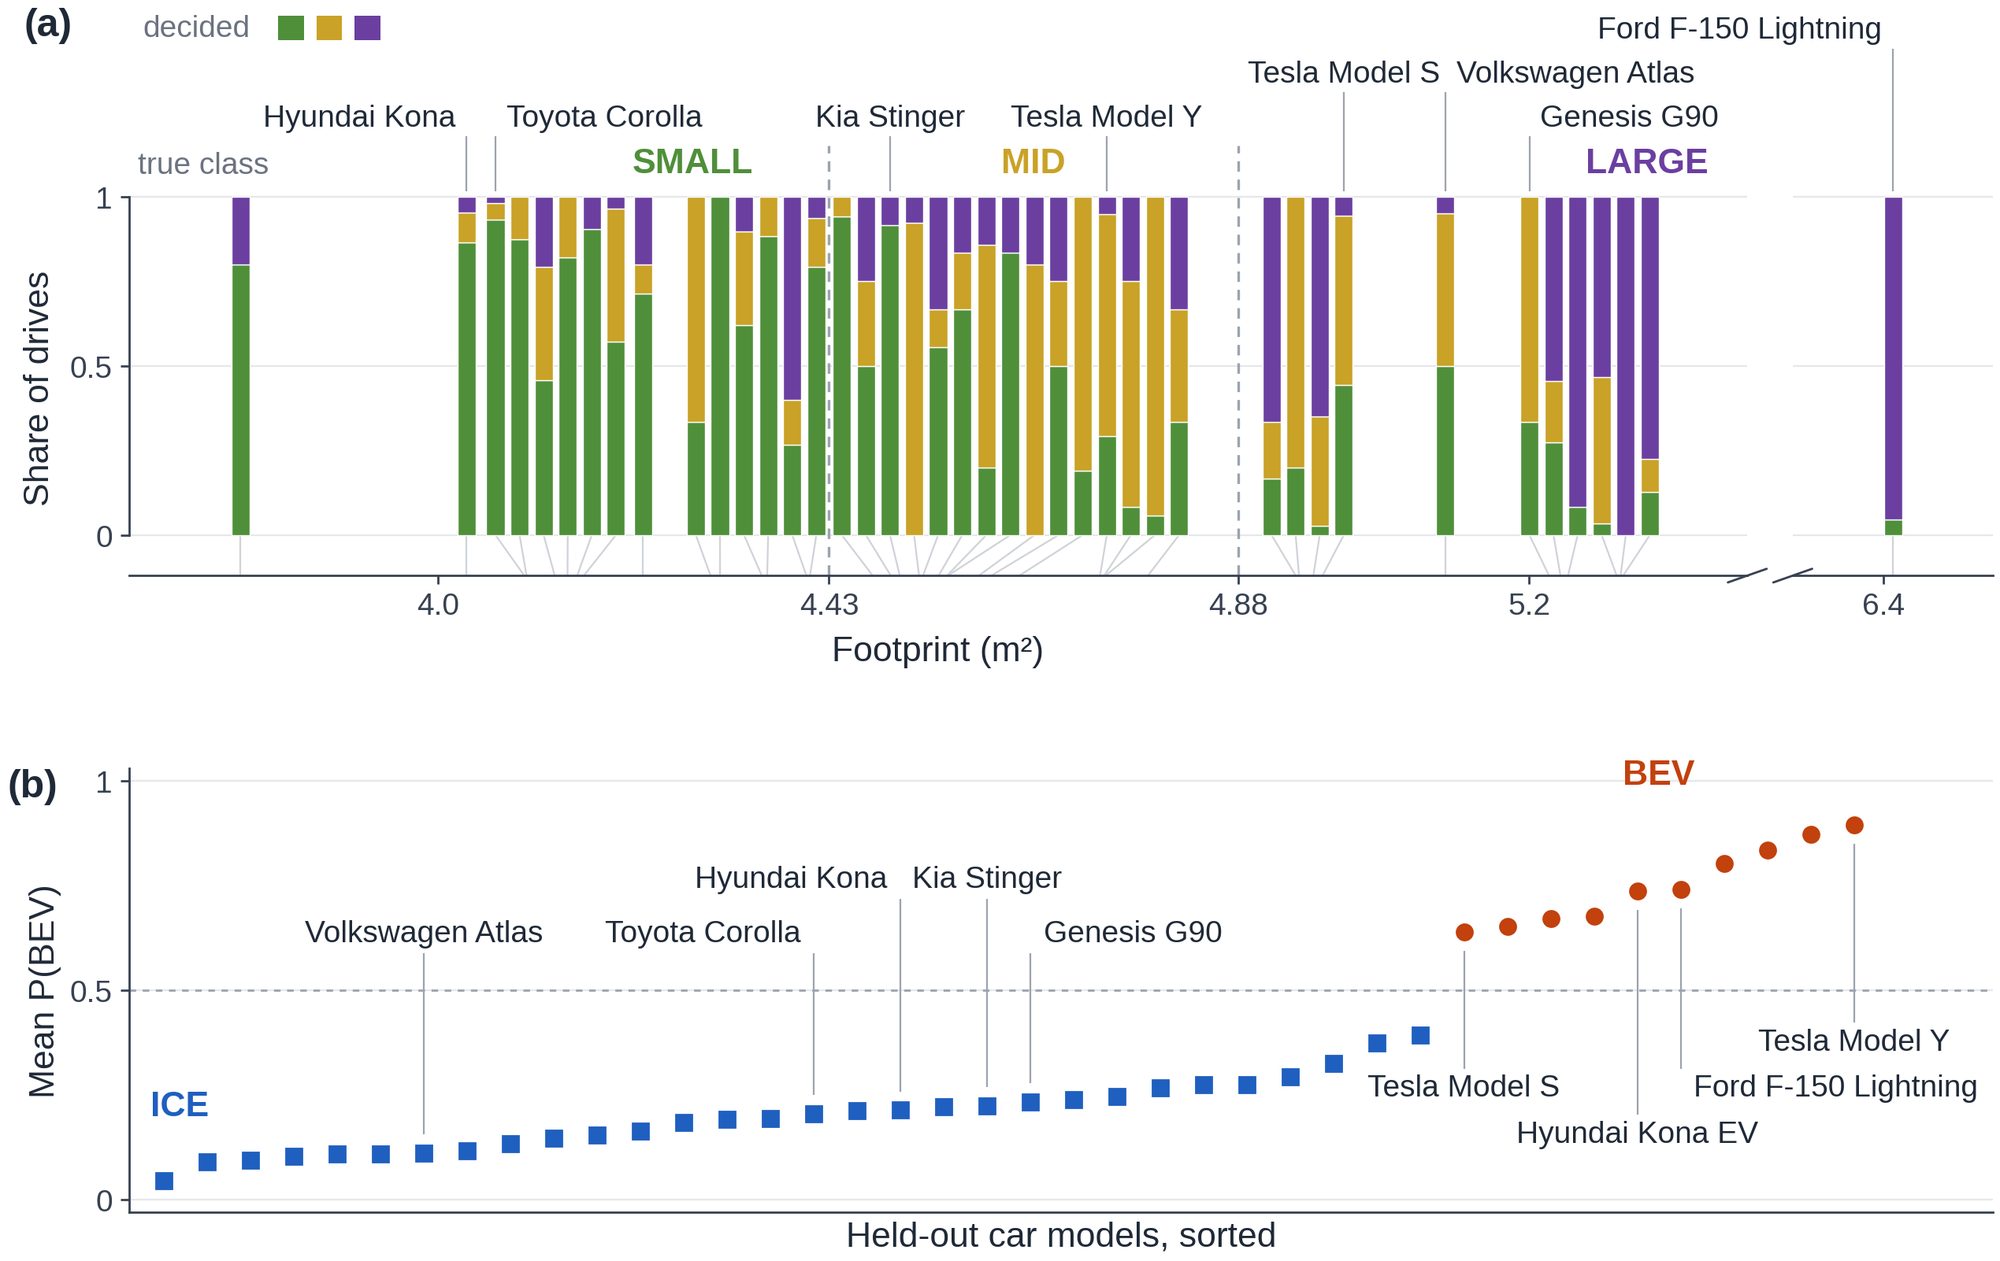
Every held-out car model: share of drives decided SMALL, MID or LARGE against footprint, and mean P(BEV) per model
Fleet overview (demo figure).

Footprint vs share of drives decided correctly, with the two class cuts

One point per held-out car model: platform footprint on the x-axis, the share of its test drives decided correctly on size (bi-GRU S9) on the y-axis; colour by size class or powertrain, hover for the model name. The class cuts are at 4.43 m² (SMALL | MID, between Kia Sportage 4.421 and Acura TLX 4.439) and 4.88 m² (MID | LARGE, between Ioniq 5 facelift 4.875 and Hyundai Genesis 4.896); most models read wrongly sit within about 0.15 m² of a cut or are large unibody cars (case figure 05). Window-level accuracy by distance of the footprint to the nearest cut: 53.0 % within 0.1 m², 59.6 % at 0.1–0.2, 75.4 % at 0.2–0.4, 89.9 % beyond 0.8.

Every held-out car model: share of drives decided SMALL, MID or LARGE against footprint
Fleet overview (demo figure); the vertical lines are the cuts at 4.43 and 4.88 m².

Window-level P(BEV) on the test windows

Histogram of the 1-D ResNet B5 (seed 1) window probability of BEV over all BEV-vs-ICE test windows, split by the true class; the dashed line is the 0.5 decision point. Single windows overlap heavily — this model's window-level macro-F1 is 79.9 (3-seed mean) — and the drive mean separates what single windows do not.

Window-level results in the table below.
04 · CASES

Nine case figures

Every drive is a held-out car model from the split_platform test split; stills are single forward-camera frames of public roads. Drive ids are public pseudonyms; car model names are the dataset's labels. Grey shading in signal panels marks DAS activity. Click a figure to enlarge.

Tesla Model Y: four stills of lift-off decelerations in one human-driven city minute, brake never pressed, whole-drive P(BEV) track
01 · Lift-off regeneration. Tesla Model Y (BEV), drive_309083: four stills of lift-off decelerations in one human-driven city minute; brake never pressed; whole-drive P(BEV) track. 1-D ResNet B5, seed 1: BEV 0.93.
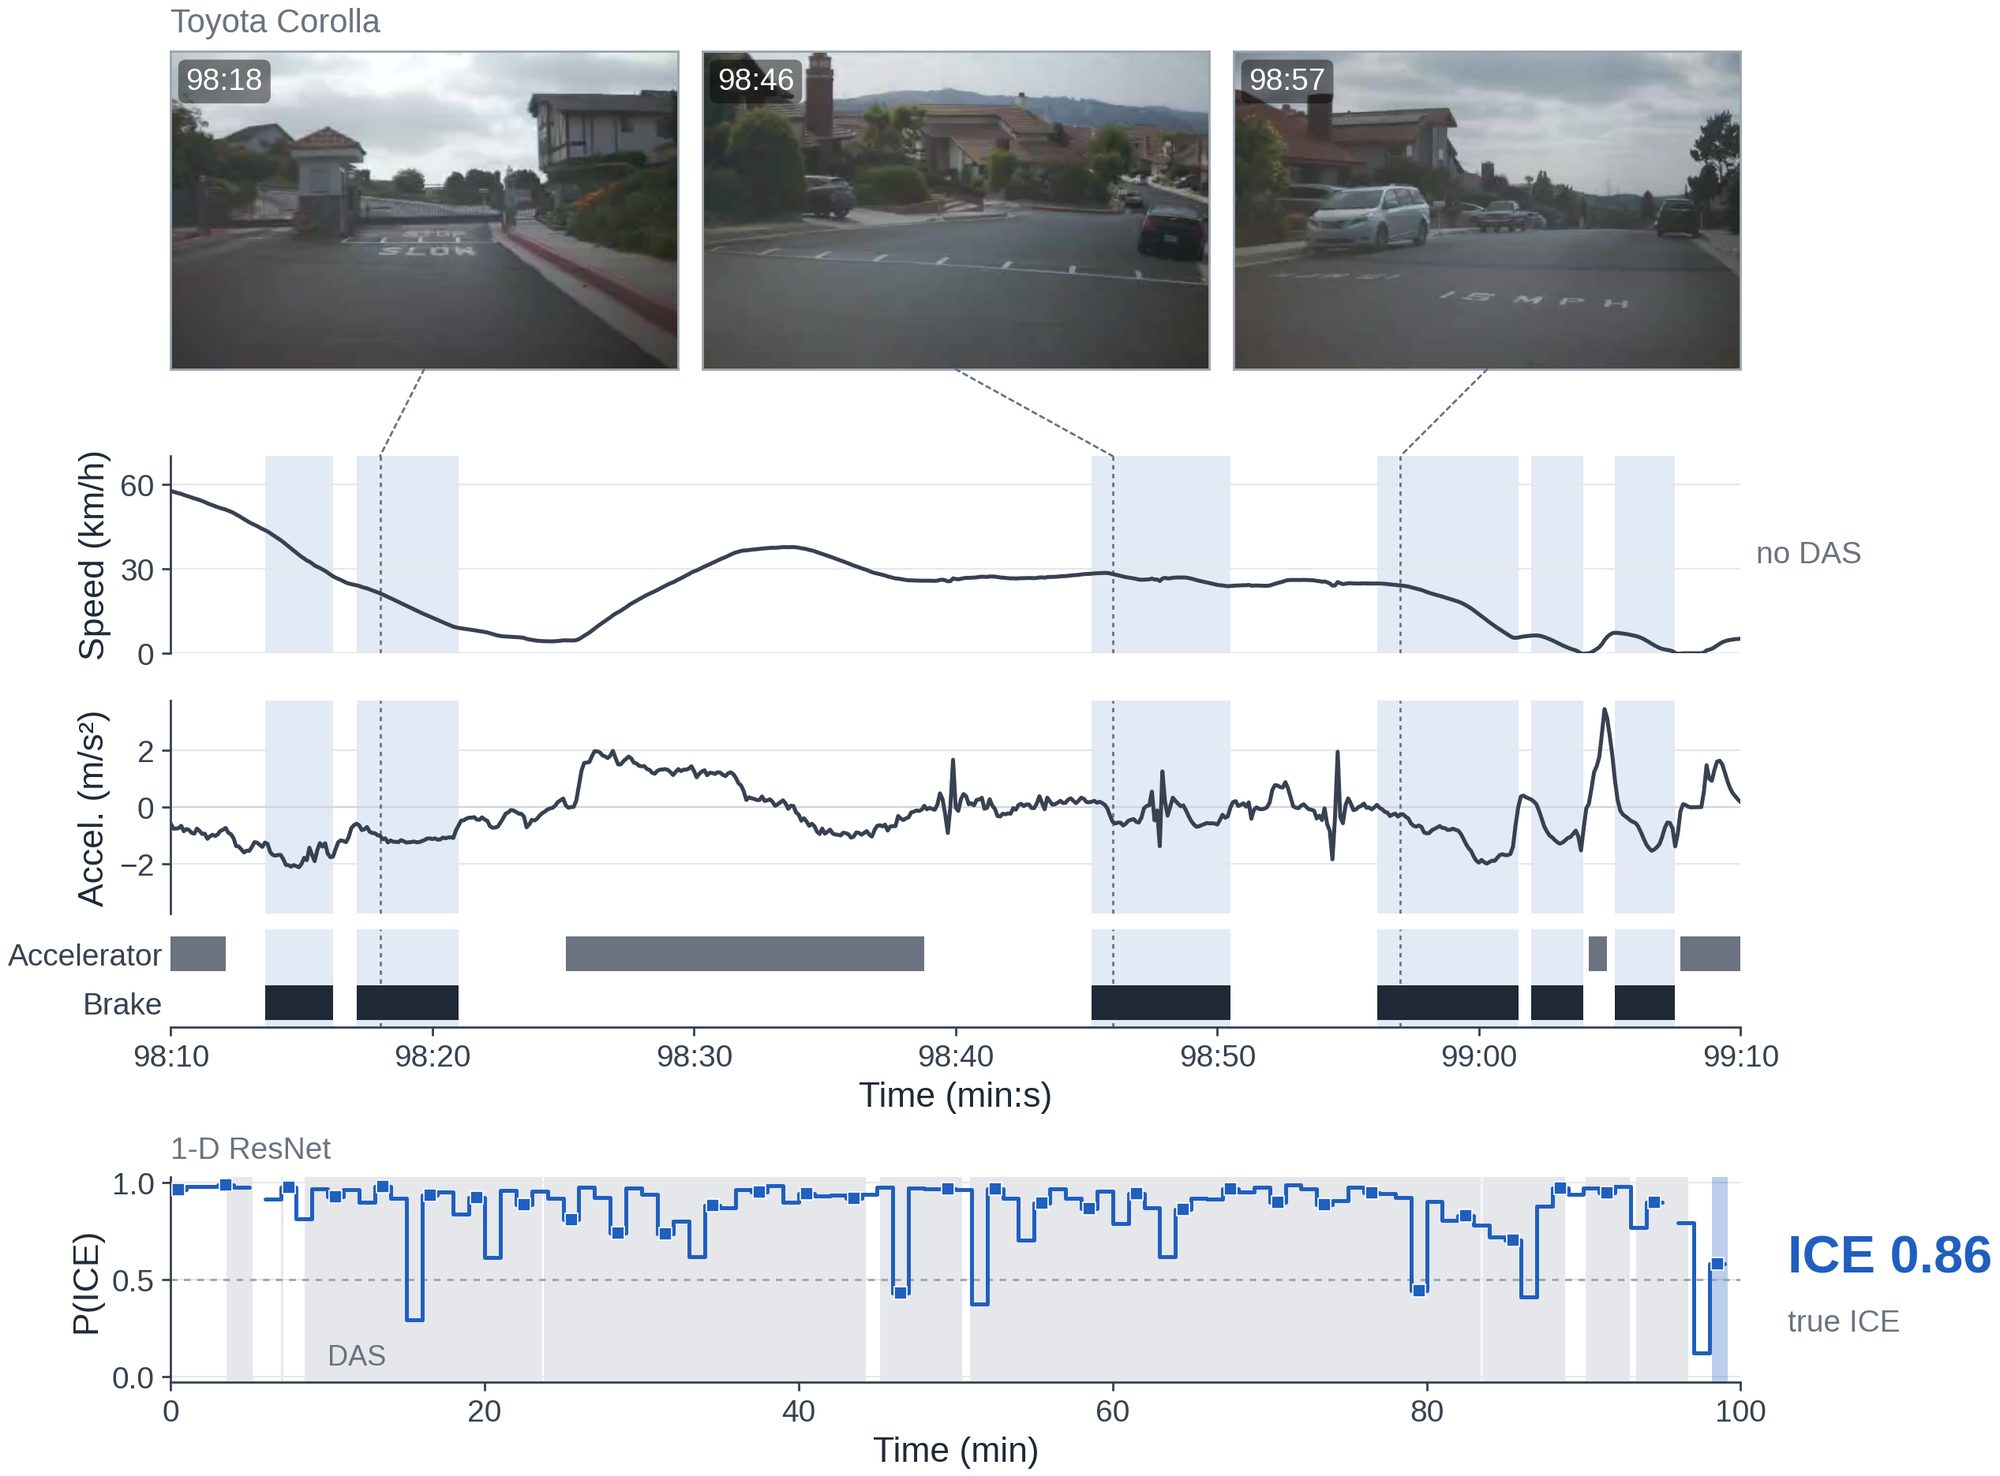
Toyota Corolla: three stills during brake-pedal decelerations of a human-driven minute, pedal lanes, whole-drive P(ICE) track
02 · Brake-pedal decelerations. Toyota Corolla (ICE), drive_351637: three stills during brake-pedal decelerations of a human-driven minute; pedal lanes; whole-drive P(ICE) track. 1-D ResNet B5, seed 1: ICE 0.86.
Tesla Model S, two drives: 92 percent DAS-driven read as ICE, 40 percent DAS-driven read as BEV, per-window DAS shading
03 · Same car, two drives. Tesla Model S (BEV), drive_868276 and drive_017429: 92 % DAS-driven read as ICE, 40 % DAS-driven read as BEV; per-window DAS shading. 1-D ResNet B5, 3-seed mean: ICE 0.95 / BEV 0.82.
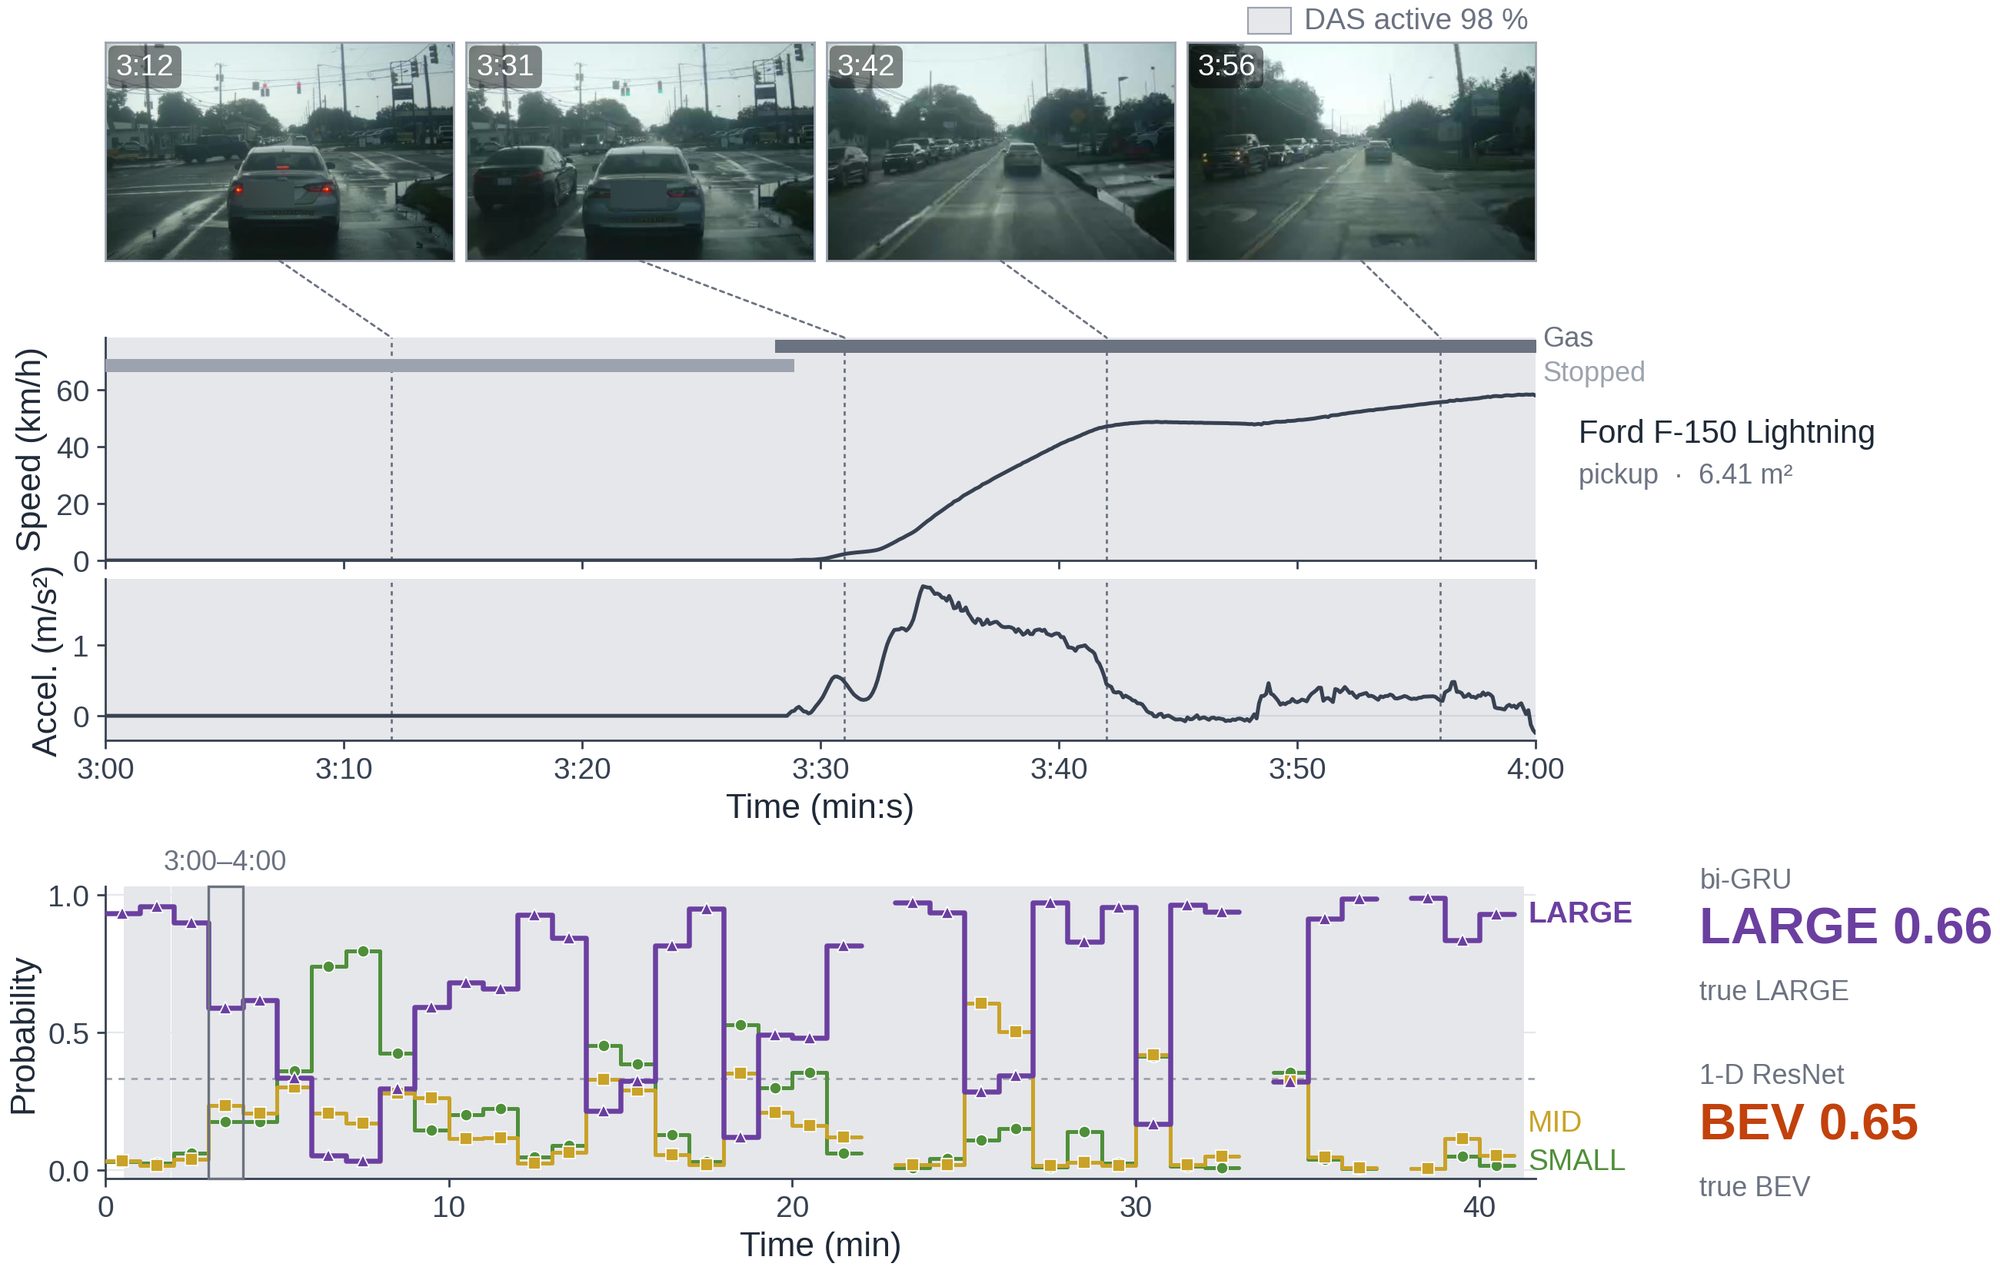
Ford F-150 Lightning at a red light, launch and cruise: speed, pedal and standstill lanes, acceleration, whole-drive size tracks
04 · A pickup launches. Ford F-150 Lightning (LARGE, BEV), drive_618938: red light, launch and cruise with speed, pedal / standstill lanes and acceleration; whole-drive size tracks. bi-GRU S9, seed 0: LARGE 0.66; 1-D ResNet B5, seed 1: BEV 0.65.
Genesis G90 and Volkswagen Atlas read as MID and SMALL; footprint panel of LARGE training hours
05 · Large unibody ceiling. Genesis G90 (drive_728036) and Volkswagen Atlas (drive_845642), both LARGE, ICE: read MID / SMALL; LARGE training hours come mostly from pickups (footprint panel). bi-GRU S9, 3-seed mean: MID 0.79 / SMALL 0.47.
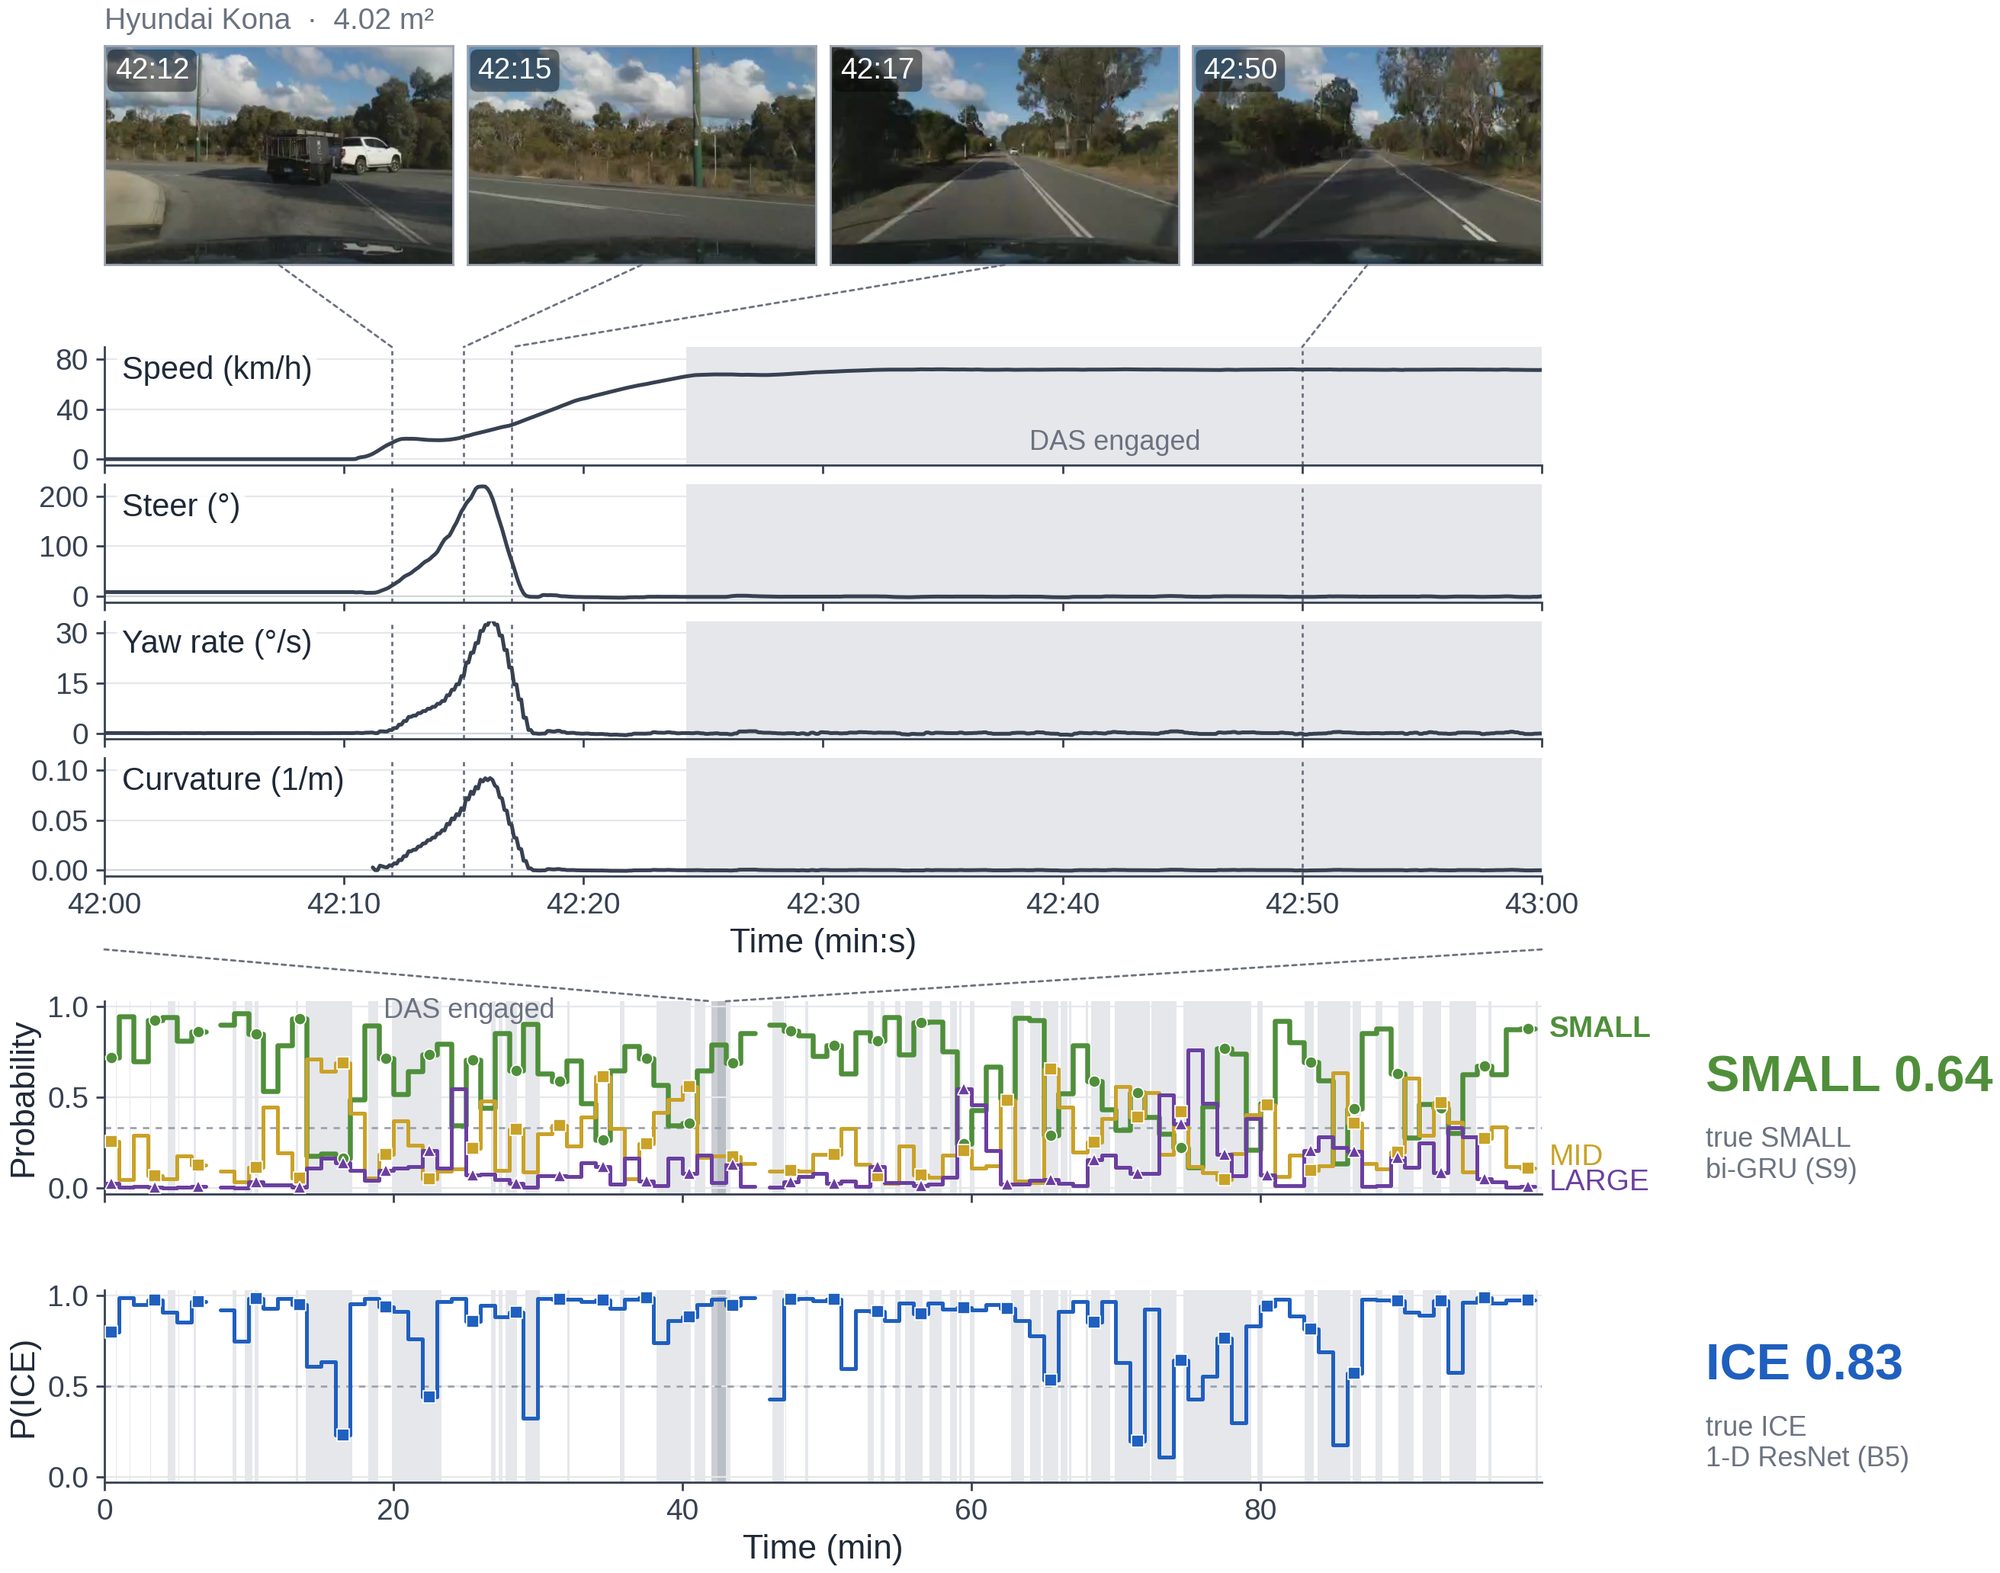
Hyundai Kona: sharp turn out of a give-way junction with speed, steering angle, yaw rate and curvature; both tasks' whole-drive tracks
06 · Both tasks on one small car. Hyundai Kona (SMALL, ICE), drive_570716: sharp turn out of a give-way junction — speed, steering angle, yaw rate, curvature; both tasks' whole-drive tracks. bi-GRU S9: SMALL 0.64; 1-D ResNet B5: ICE 0.83 (3-seed means).
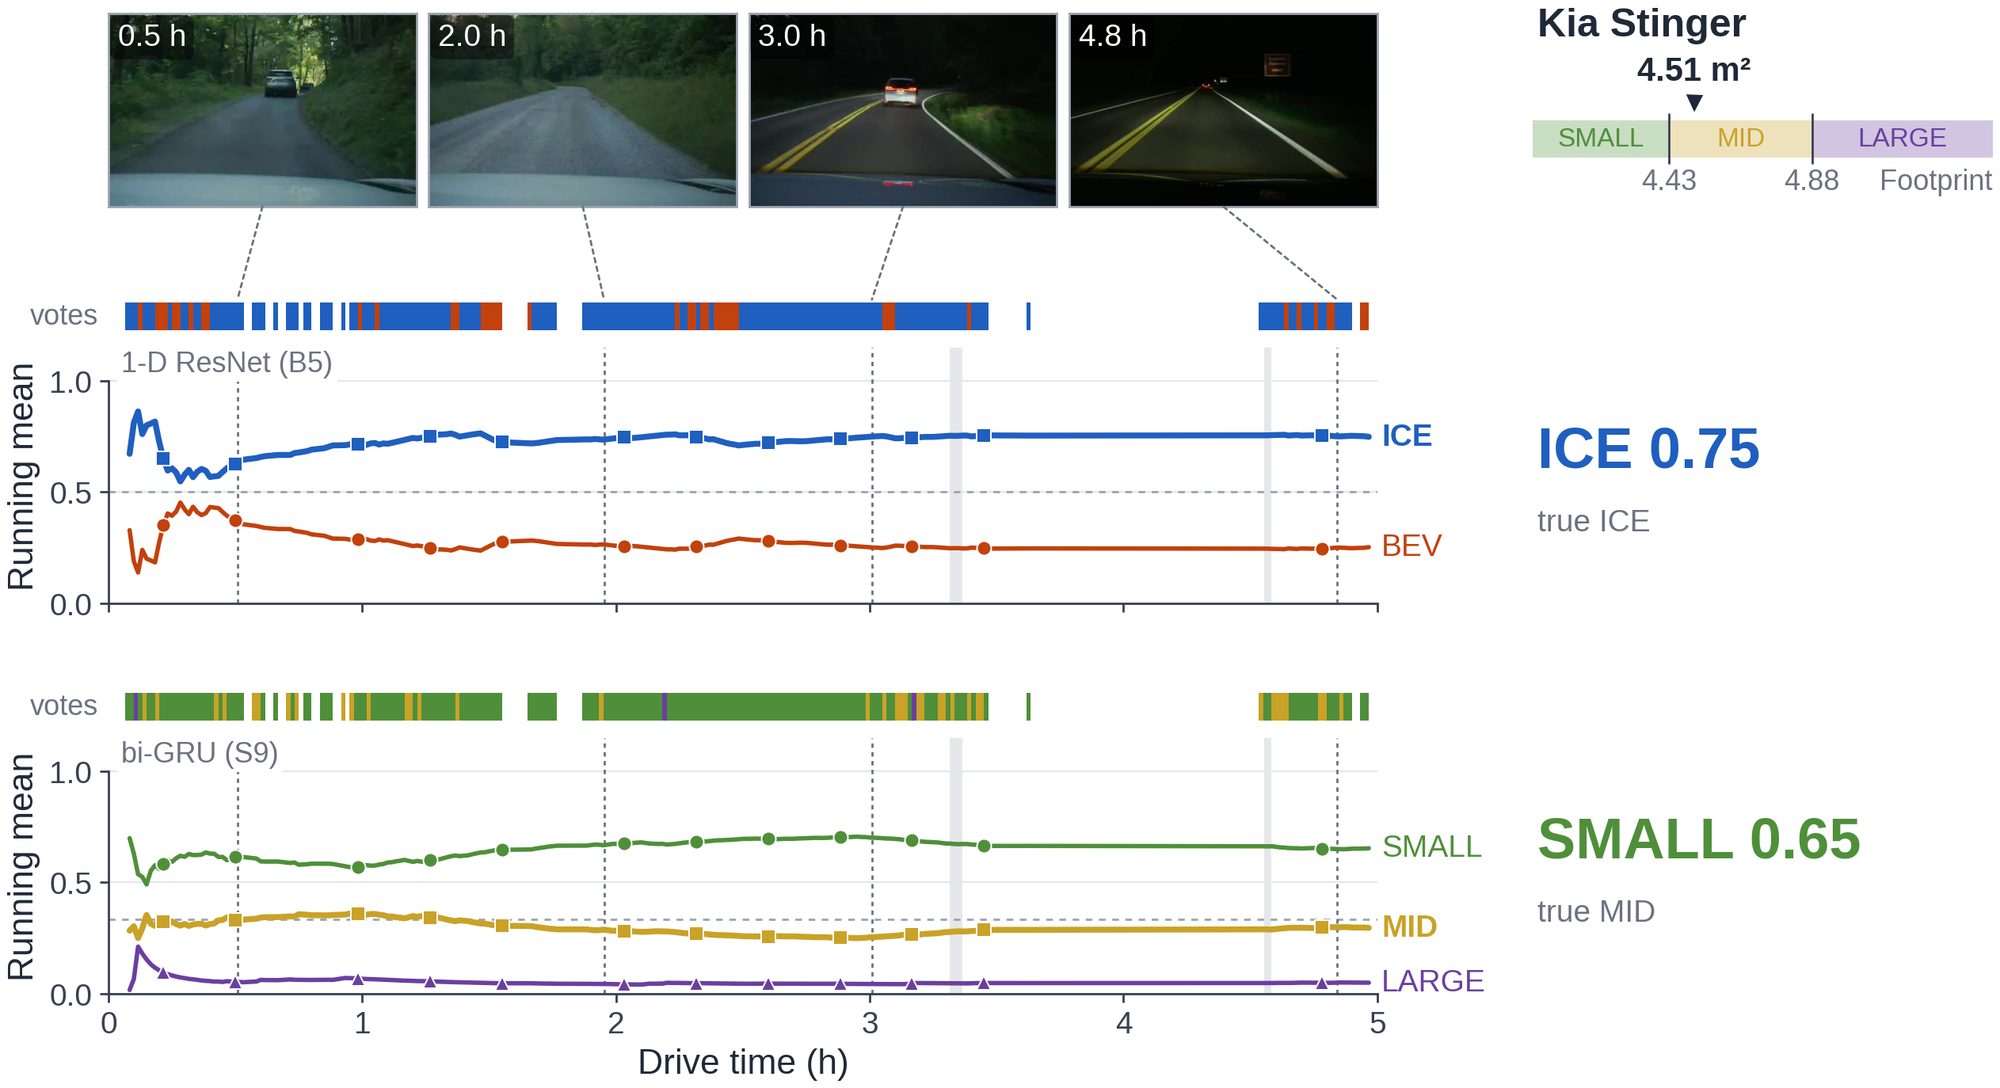
Kia Stinger: running drive-level mean along a five-hour drive with per-window votes; footprint 4.51 square metres just above the SMALL/MID cut
07 · Evidence accumulation. Kia Stinger (MID, ICE), drive_878942: running drive-level mean along a 5-h drive with per-window votes; footprint 4.51 m², just above the SMALL | MID cut. 1-D ResNet B5: ICE 0.75; bi-GRU S9: SMALL 0.65 (3-seed means).
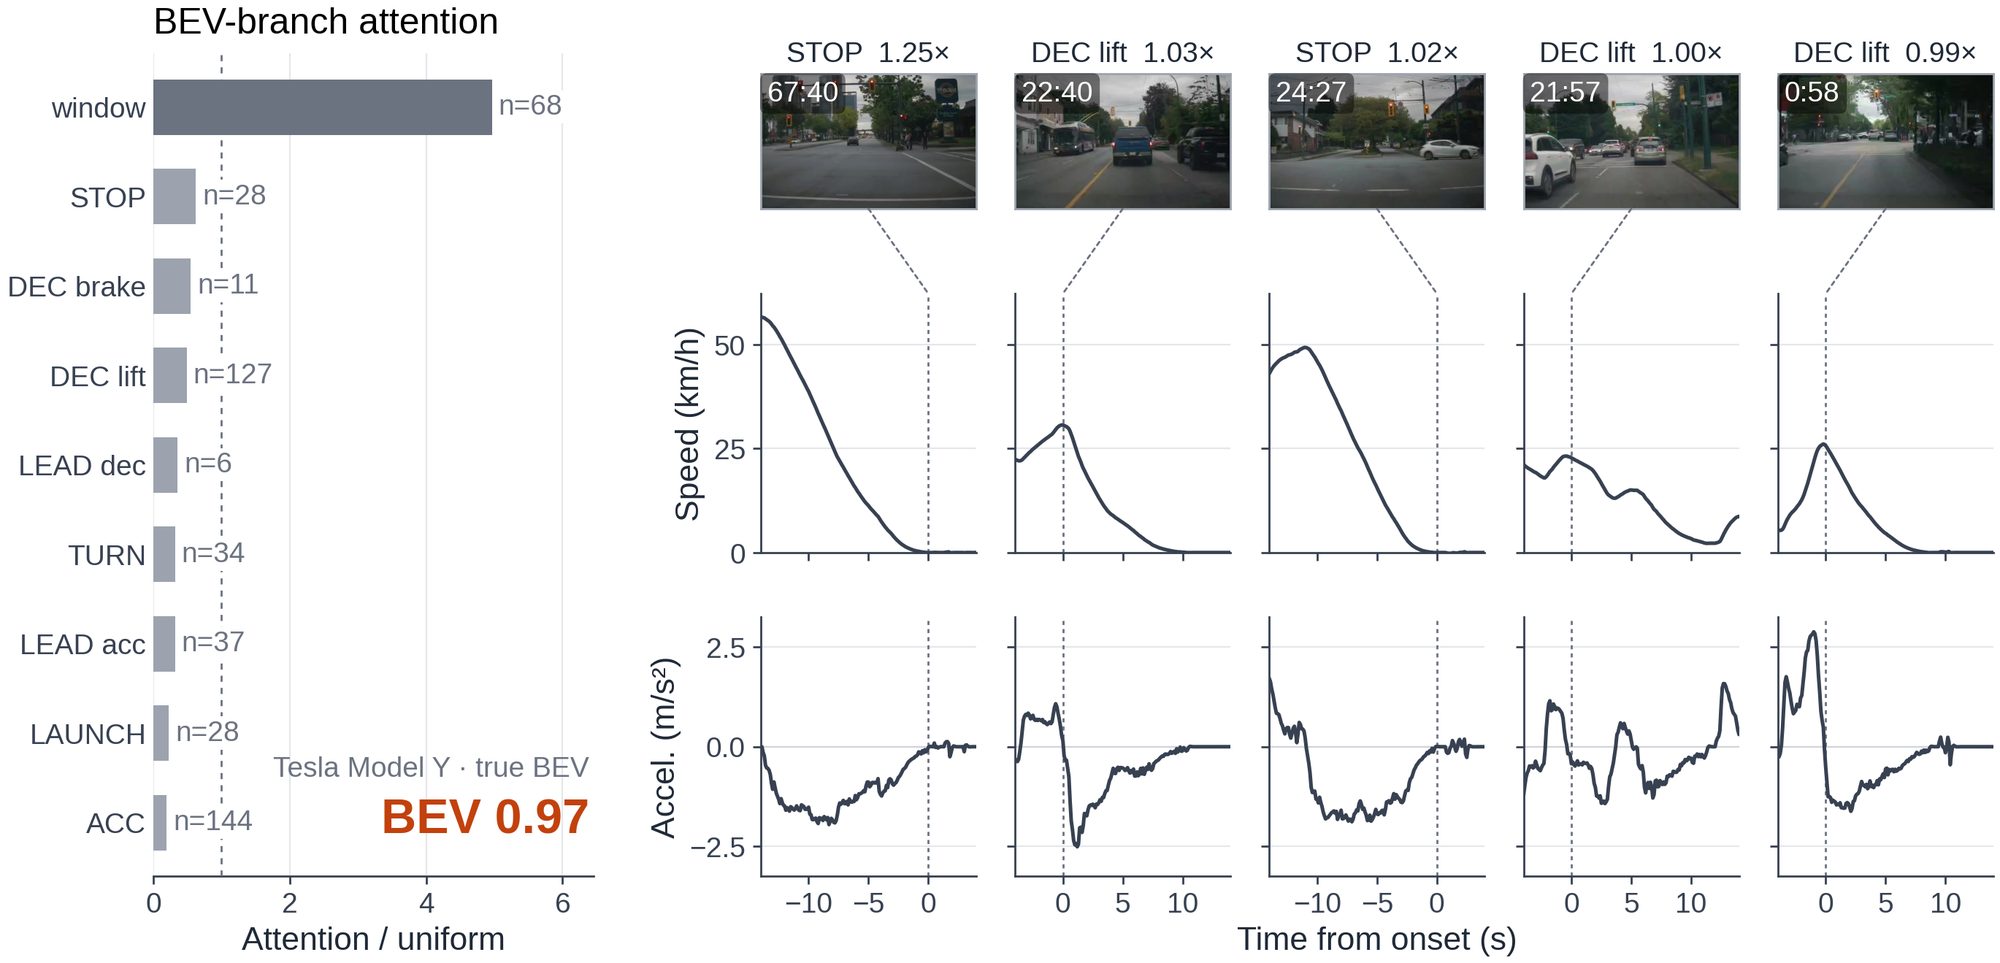
Episode MIL: gated attention per instance type and the five most-attended episodes with stills and 18-second crops
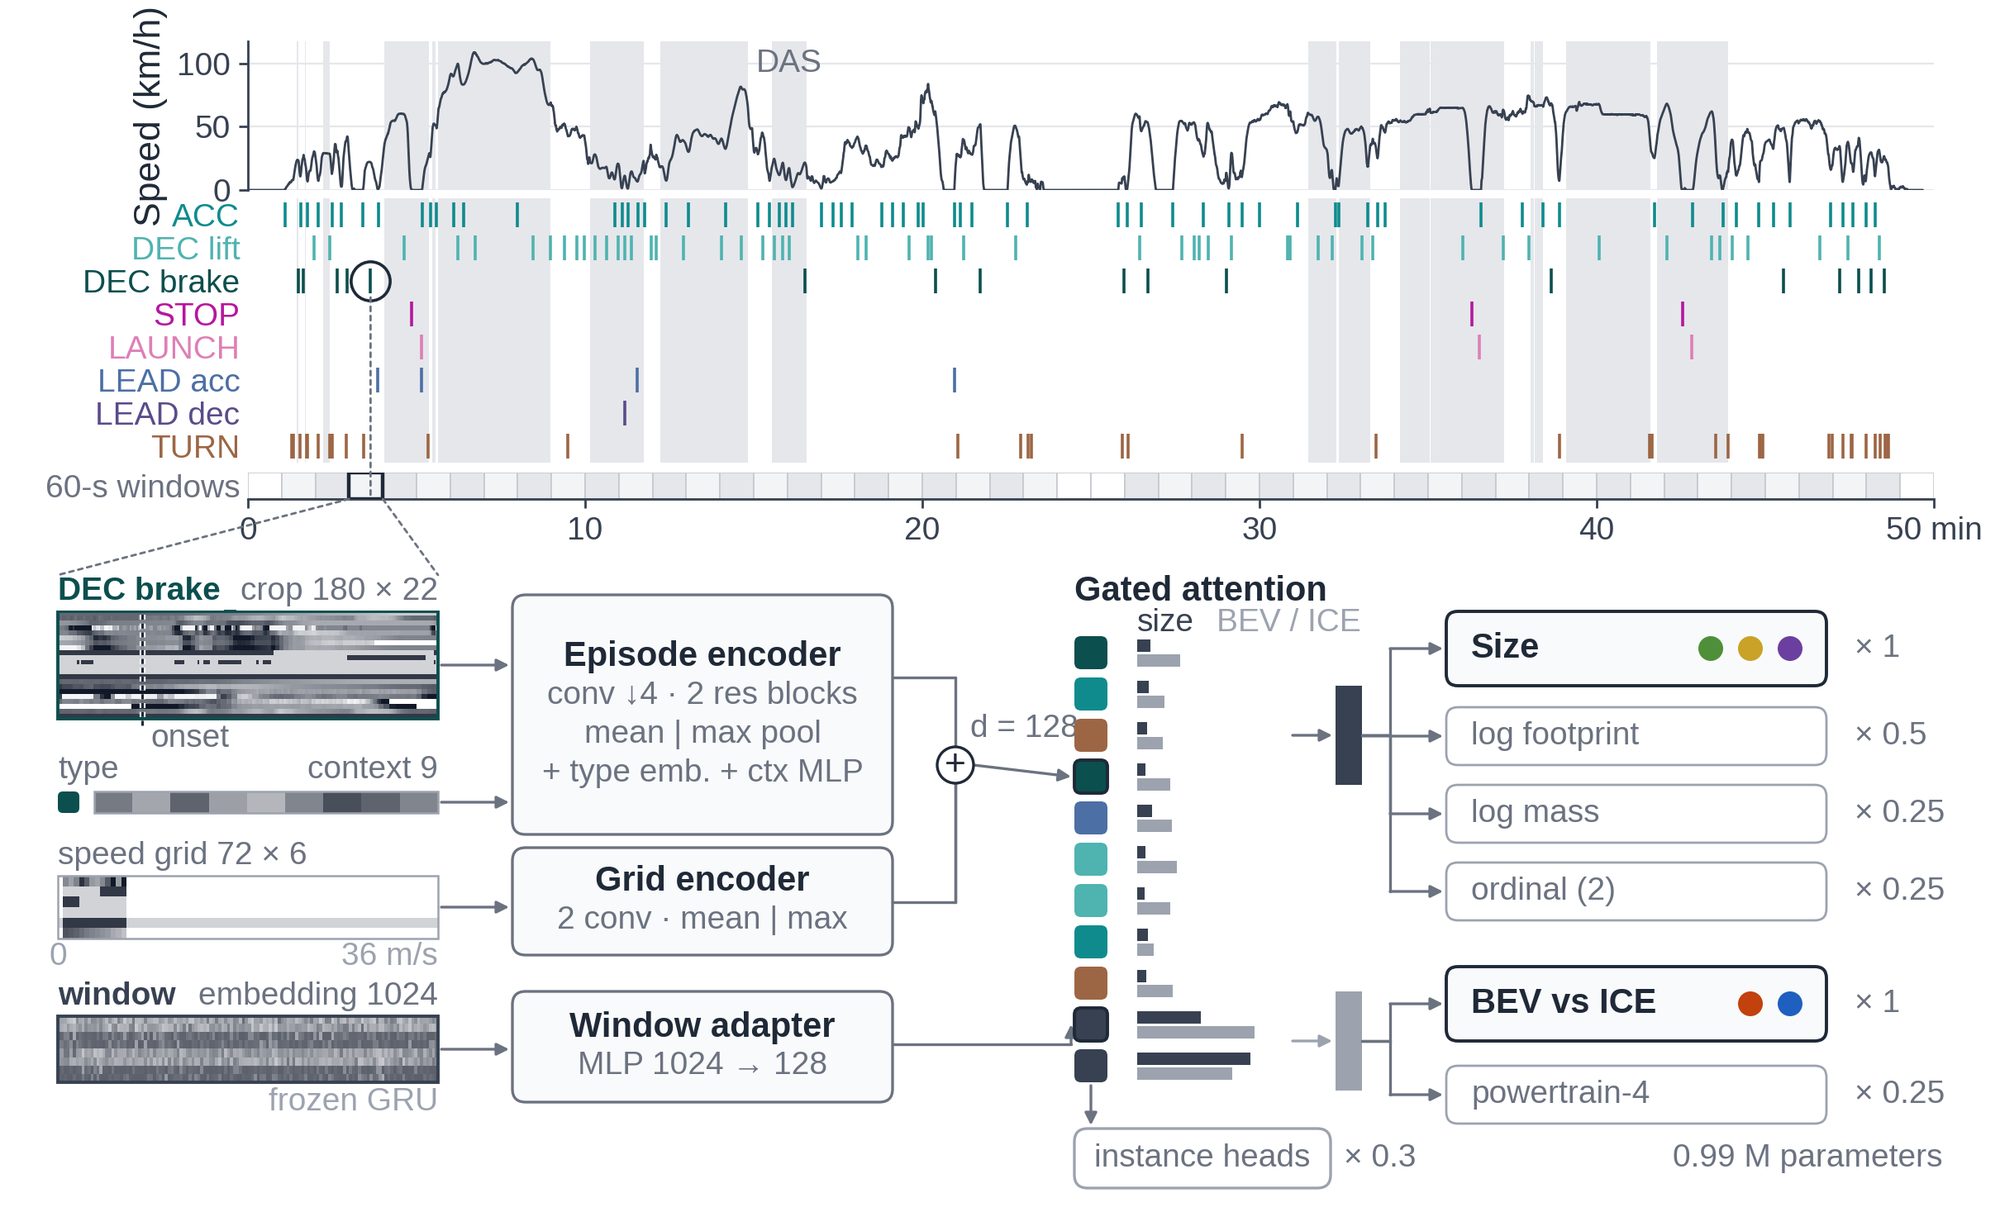
08 · Where the MIL model looks. Tesla Model Y (BEV), drive_309083: gated attention per instance type (windows dominate) and the five most-attended episodes with stills and 18-s crops. Episode MIL, seed 0, BEV branch: BEV 0.97.
Every held-out car model: share of drives decided SMALL, MID or LARGE against footprint, and mean P(BEV) per model
09 · The held-out fleet. Every held-out car model: share of drives decided SMALL / MID / LARGE against footprint (a); mean P(BEV) per model (b). (a) bi-GRU S9, seed 0; (b) 1-D ResNet B5, seed 1. No stills.
05 · METHOD

Window models, an episode model, and a protocol that cannot peek

Sequence models on 600-sample windows of the 20 official channels; a recipe pre-registered on model-disjoint internal folds; an episode-centric multiple-instance model over driving transients; and an evaluation that holds out whole car models and bootstraps over them.

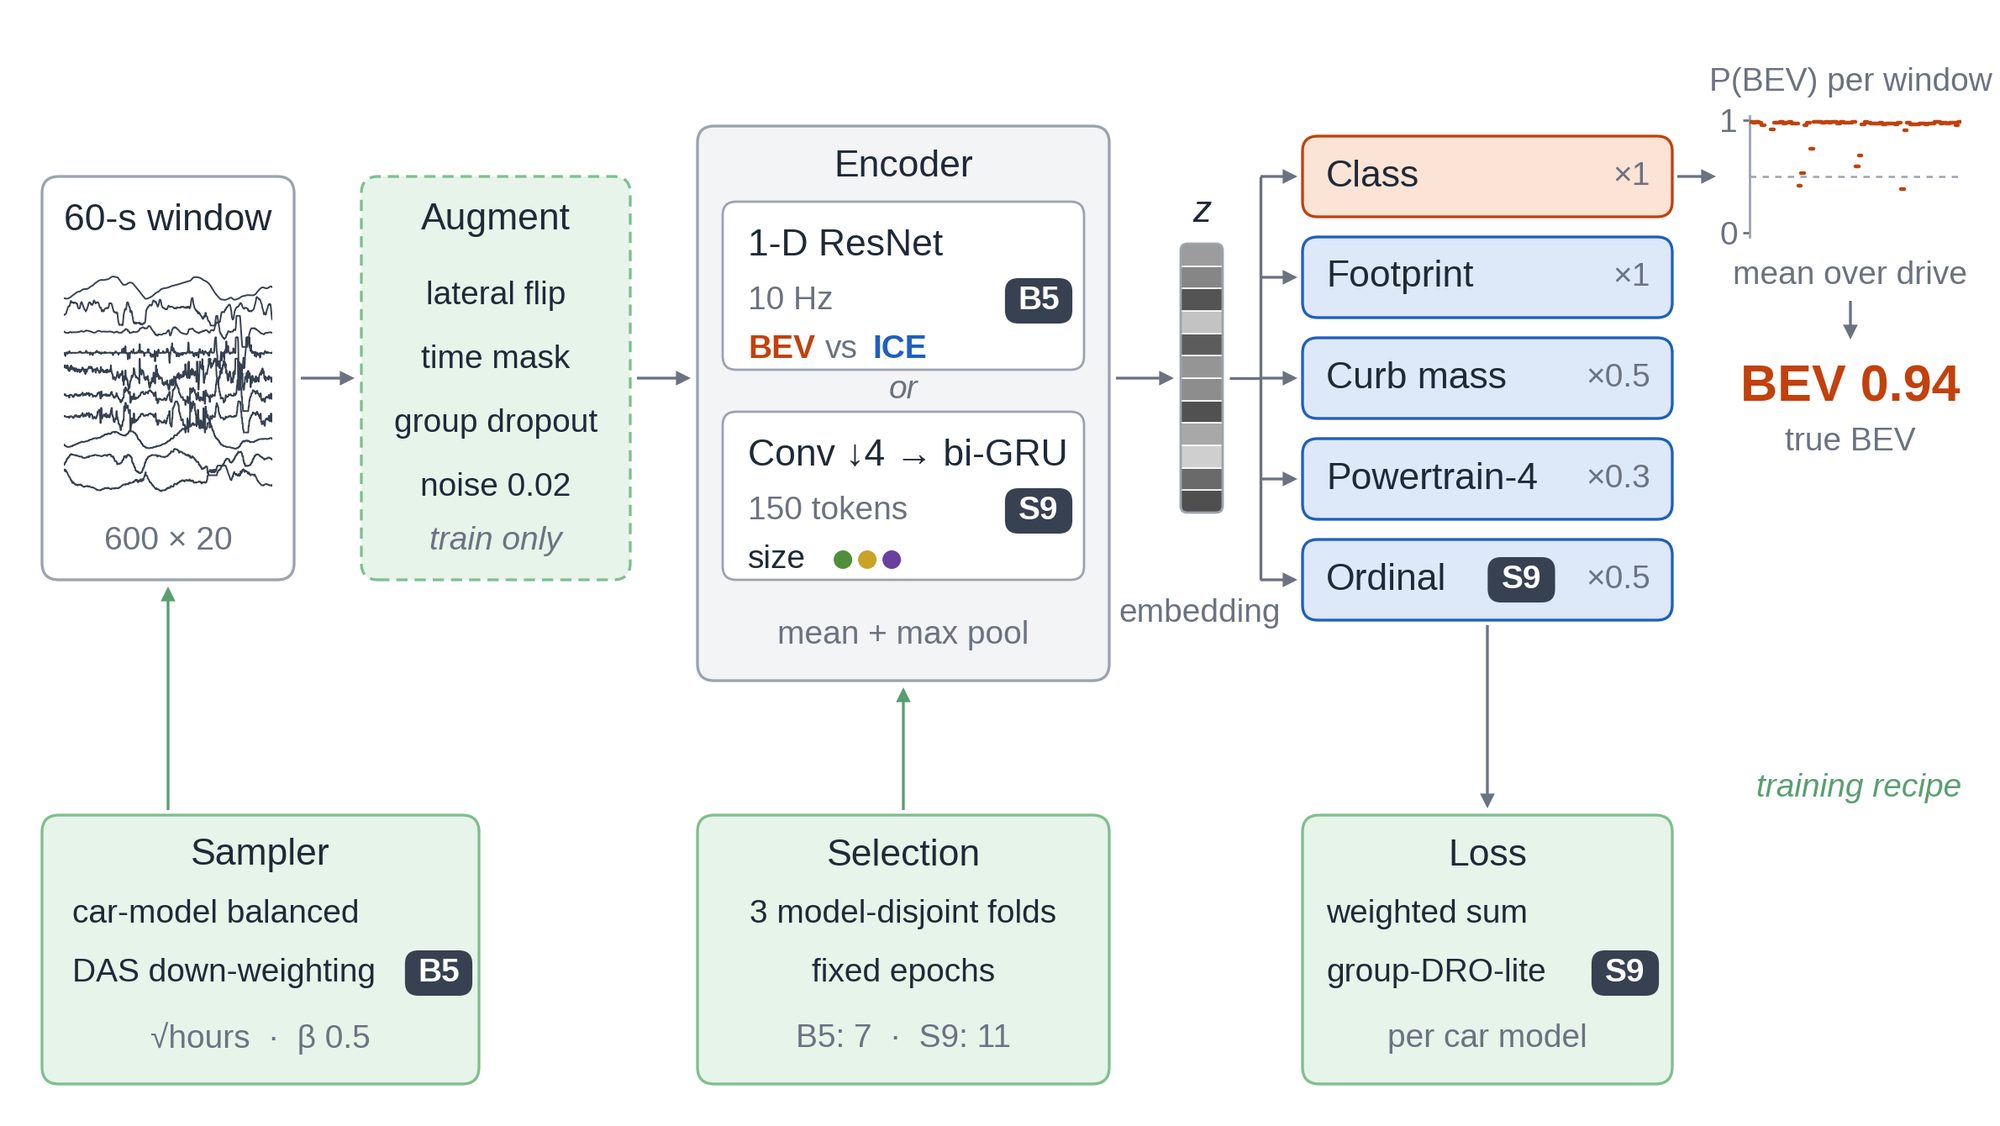
Window model and recipe: physics-safe augmentation, 1-D ResNet or convolutional stem plus bi-GRU encoder, multi-task heads, car-model-balanced sampler, selection and loss
Window model and recipe. Physics-safe augmentation (lateral sign flip of the six lateral channels, a masked 3–15 s span with lead_valid set to 0, channel-group dropout, 0.02 noise; no speed or amplitude scaling, no time reversal), an encoder (1-D ResNet on the 10 Hz signal, or a stride-4 convolutional stem into a bi-GRU), heads for the class plus footprint regression, CORAL ordinal size, log curb mass and four-class powertrain, car-model-balanced sampling (hours^0.5), DAS down-weighting (β = 0.5) and group-DRO-lite; final models train for a fixed number of epochs set on the folds. Data glyphs from drive_309083.
Episode-MIL model: drive timeline with eight episode types and windows, instance encoders, gated attention, drive-level heads
Episode MIL. Eight episode types (acceleration, lift-off and brake decelerations, stop, launch, lead acceleration and deceleration, turn) as 18-s onset-anchored crops plus a speed-indexed a(v) grid, together with frozen 60-s window embeddings as instances; a shared encoder (d = 128), gated attention pooling per task and drive-level heads, about 0.99 M parameters. It matches the window recipes on the test models (BEV vs ICE 90.2, own bag 93.0; size 64.6) but does not beat them. Timeline of drive_017429 with real attention weights.
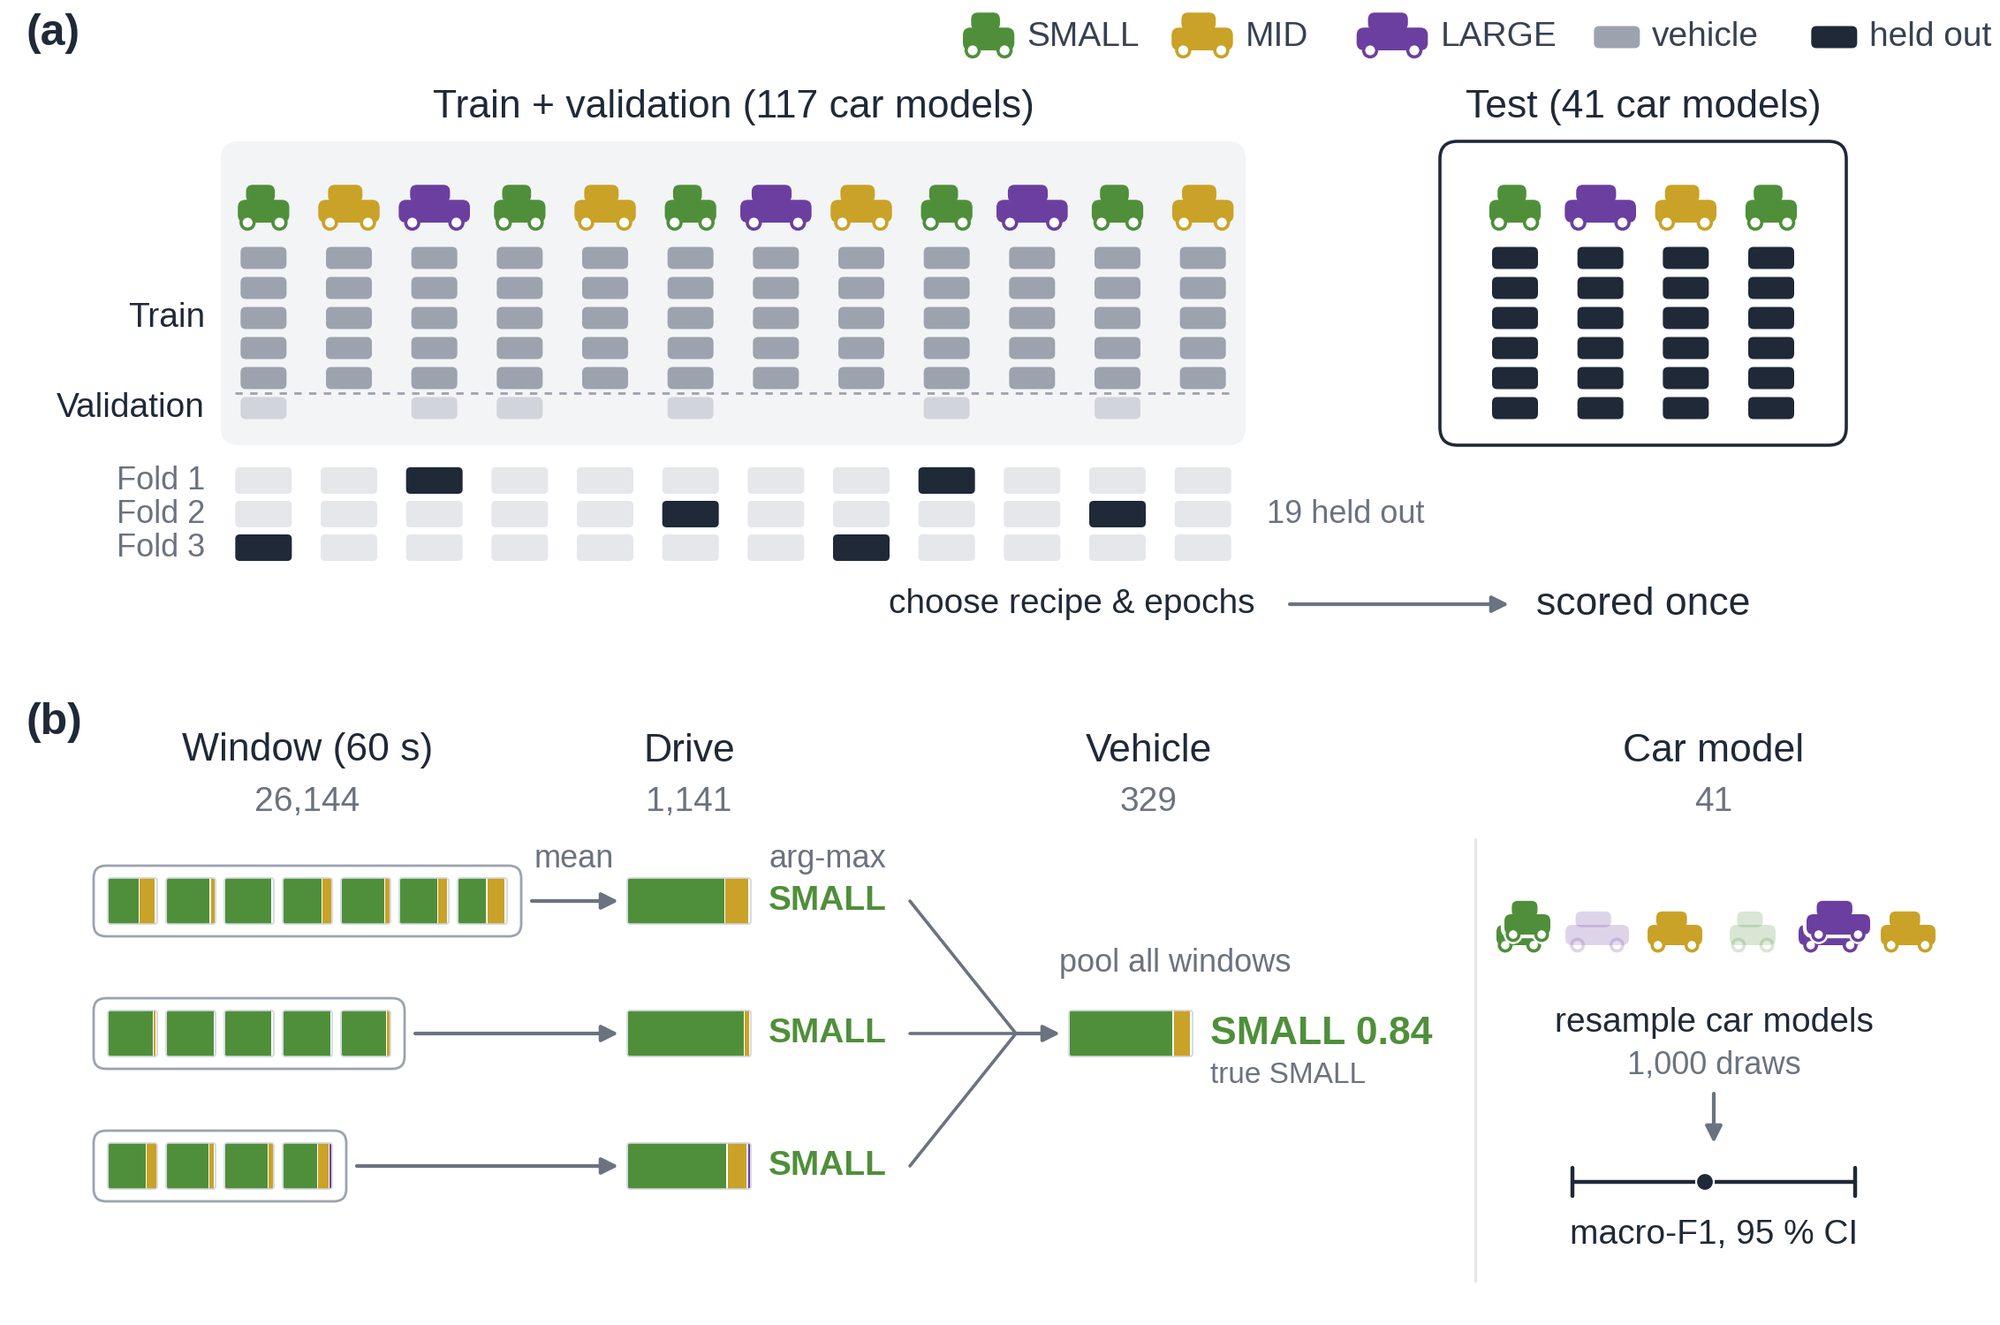
Evaluation design: 41 held-out car models, three model-disjoint internal folds, window to drive to vehicle levels, car-model bootstrap
Evaluation design. 41 car models held out as the test split; three model-disjoint internal folds over the train + validation pool for every recipe decision (the shared-model validation split rewards memorising car models: best epochs 16–22 there against 1–8 on the folds); window → drive → vehicle levels; 95 % intervals by cluster bootstrap over car models (1,000 resamples). Example: one test vehicle, Kia Ceed (SMALL), read SMALL 0.84 by the bi-GRU S9.

Inputs and labels

Drive tables are indexed by car-state sample (row k = k-th 10 Hz sample); radar, pose and controller topics are zero-order held causally onto the sample times. Footprint = wheelbase × mean track per platform; the cuts 4.43 / 4.88 m² were fixed from the label inventory alone before any classifier (every size × {BEV, ICE} cell ≥ 100 h, ≥ 3 car models, ≥ 5 identity groups). Pedal magnitudes are missing on many vehicles, so only the pressed flags are inputs.

Reference recipe

Class-balanced sampling with weights (N / K n_k)^0.5 capped at 10, AdamW, warm-up + cosine, label smoothing 0.05, batch 256, at most 25 epochs with early stopping on the validation macro-F1. 1-D ResNet 2.31 M parameters, bi-GRU 0.73 M, Transformer 0.70 M, bidirectional Mamba-2 1.07 M (a pure-PyTorch implementation of the published chunked state-space-duality scan).

LLM-proposed physical features

Six proposer agents, one physics lens each, saw only the channel definitions and a training-only sample of 2,727 windows; verifiers ran and fixed the code, an auditor removed duplicates, speed confounds and cues that come from the automation controller; 34 of 74 proposals were registered before any evaluation split was touched and fed gradient boosting. Lift-off deceleration features rank highest for powertrain; curvature-per-steering gains for size.

06 · RESULTS

Tables, reference recipe first

Macro-F1 in percent; mean over three seeds where several ran (feature baselines and the held-out-devices Mamba-2 / MIL rows are single runs). Window = one prediction per 60-s window (test_full); drive = mean of the per-window probability vectors; vehicle = the same over all test drives of a pseudonymous vehicle.

Headline · split_platform · 41 held-out car models · window / drive / vehicle macro-F1 · experiments/RESULTS.md

MethodInputSize · SMALL / MID / LARGEPowertrain · BEV vs ICE
windowdrivevehiclewindowdrivevehicle
Chance level—≈ 33≈ 33≈ 33≈ 50≈ 50≈ 50
Statistics + gradient boosting180 window statistics49.754.751.569.573.276.0
LLM features + statistics + gradient boosting+ 34 physical features54.164.961.873.280.983.4
1-D ResNet20 channels · 10 Hz53.661.156.478.491.190.3
bi-GRU20 channels · stem54.762.957.279.289.088.6
Transformer encoder20 channels · stem52.561.855.377.088.489.0
Mamba-2, bidirectional20 channels · stem53.161.255.277.389.490.6
Final recipe · bi-GRU S9 / ResNet B5recipe S9 / B553.267.160.079.993.092.8
Final recipe · ResNet S9 / bi-GRU B5recipe S9 / B553.266.862.677.092.693.4
Episode MILepisodes + window embeddings54.264.662.378.890.290.4

95 % cluster-bootstrap intervals (drive level, mean of the seeds' bounds): bi-GRU S9 size 67.1 [54.4, 74.2]; ResNet B5 BEV vs ICE 93.0 [87.2, 96.6]; bi-GRU B5 92.6 [87.1, 96.2]; reference bi-GRU size 62.9 [48.9, 72.4]; reference ResNet BEV vs ICE 91.1 [83.4, 95.7]. Human-only drives (no DAS activity): size 61.7 / 62.9 (GRU S9 / ResNet S9), BEV vs ICE 89.1 / 88.7 (GRU B5 / ResNet B5). The MIL rows use window-mean aggregation; its own bag prediction gives 64.3 (size) and 93.0 (BEV vs ICE).

Honest limits. Size stays far from 90 on unseen car models, and the ceilings say why: the cuts fall inside dense regions of the fleet (21 of 41 held-out models within 0.15 m² of a differently-labelled training model), LARGE is learned largely from pickups so large unibody cars read MID or SMALL, and a footprint oracle needs about ±0.12 m² of error to reach 90 — a label-resolution and fleet-composition limit, not a capacity one. Also: one logger ecosystem and a region skew (83.8 % of the hours in North America); labels are platform attributes, so a misidentified platform mislabels every drive of that vehicle; platforms sold with several powertrains are excluded from task B; 62.6 % of the samples carry DAS activity, so part of the signature belongs to the controller (human-only protocols are reported for that reason); the validation split shares car models with training, so recipe decisions were taken on model-disjoint internal folds and the final models train for a fixed epoch count; the case drives are hand-picked; the paper is in submission and its numbers may still change.

Sources & notes
    07 · DATA & ACCESS

    Get the drives

    On request

    VTT · release v1

    9,062 drive tables at 10 Hz (8.1 GB), ready-to-train 60-s window shards (4.4 GB, 194,949 windows in 41 files), index tables with labels, specifications and both split assignments, balanced evaluation lists, training weights and machine-readable schemas. No video, images, positions, timestamps or driver-monitoring signals.

    as of 2026-11-09 · gated: manual · CC BY 4.0

    Open · MIT

    Code & protocol

    Build pipeline, the official input list, the protocols and splits, the starter kit, every baseline and the method campaign — window recipes, episode MIL, internal folds, oracles — with the results tables (experiments/RESULTS.md) and the paper draft under paper/.

    Draft

    Paper

    “Reading Vehicle Size and Powertrain from Motion: A Trajectory–CAN Benchmark with Held-Out Car Models, Pre-Registered Methods and Label Ceilings” — in submission to IEEE IV 2027. The draft on this page is the authors' version and may change.

    “Access is granted for research on vehicle dynamics and driving behaviour. Re-identification of vehicles or drivers and linkage with other datasets are prohibited.”Hugging Face dataset card · release v1 · fetched 2026-11-09

    Terms. The data tables are released under CC BY 4.0 with manual approval of access requests; the code is MIT. Pseudonyms are random and drawn for this release only; no re-identification and no linkage with other datasets; labels describe vehicle models, not people. Cite the paper when you use VTT.

    08 · CITE

    Read the draft, cite the benchmark

    A placeholder entry for the IEEE IV 2027 submission; it will be replaced by the final reference once the paper is published.

    BibTeX
    @inproceedings{wang2027vtt,
      title     = {Reading Vehicle Size and Powertrain from Motion: A Trajectory--CAN Benchmark
                   with Held-Out Car Models, Pre-Registered Methods and Label Ceilings},
      author    = {Wang, Yuhang and Guo, Yuechen and Yang, Jingxin and Wei, Chuheng and Chen, Suyang
                   and Alhuraish, Abdulaziz and Wang, Yiyi and Sun, Jingran and Zhou, Hao},
      booktitle = {IEEE Intelligent Vehicles Symposium (IV)},
      year      = {2027},
      note      = {In submission. Dataset: https://huggingface.co/datasets/HenryYHW/Vehicle_Power_Type_Trajectory_Dataset}
    }

    Related work from the lab