Skip to content

Dataset & benchmark · human–automation transitions · arXiv 2026

BATONA Multimodal Benchmark for Bidirectional Automation Transition Observation in Naturalistic Driving

Control transitions observed in both directions on the same synchronized streams — and takeover scored twice: onset detection (T3-D), where the driver's inputs are visible, and pre-override anticipation (T3-A), where they are withheld.

781 real-world driving-automation routes from 173 drivers across 108 vehicle models, 204.9 hours. Front video, in-cabin video, decoded CAN, radar lead interaction and route context form one record around every handover and takeover. The frozen benchmark subset holds 565 routes, 162.1 h and 3,593 events.

arXiv 2604.07263 · v2 · 20261,800 ↑ handovers · 1,793 ↓ takeoversCC BY-NC 4.0 · sample auto-approved

Yuhang Wang1·Yiyao Xu1·Chaoyun Yang2·Lingyao Li3·Jingran Sun1·Hao Zhou1

1University of South Florida · MOTIF-Lab   2Tongji University   3University of Arizona

● REC
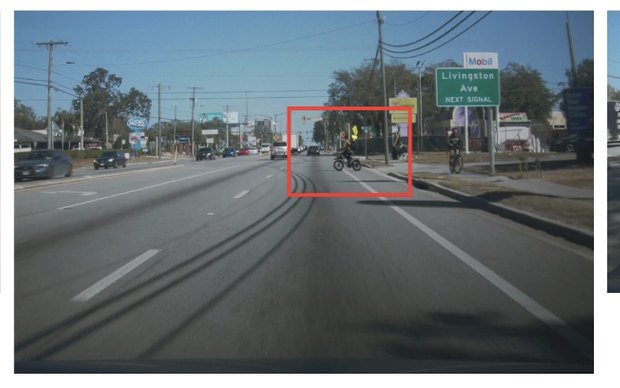
Front-camera frame at the moment the driver takes control back
live · public sample route · 10 Hz↑ handover · ↓ takeover

Frozen benchmark on Hugging Face: 565 routes · 162.1 h · 150 drivers · 3,593 events (1,800 ↑ handovers / 1,793 ↓ takeovers). The arXiv listing abstract still shows the v1 figures (136.6 h, 127 drivers, 380 routes); the v2 paper body (27 Jul 2026) and the Hugging Face card describe the current release.

01 · OVERVIEW

Who is driving, and when does that change?

The v2 abstract, verbatim, beside what you need to know at a glance.

Existing Level-2 driving-automation (DA) systems on production vehicles still rely on human drivers to decide when to engage automation, and ask for drivers' continuous attention and readiness to intervene in case of emergency. This human–machine-interface (HMI) design demands good situational judgment and imposes high cognitive loads, producing a steep learning curve for new drivers, poor DA user experience, and possibly increased safety risks. Improving DA HMIs hinges on accurately predicting when drivers hand control to automation and when they take it back, but no existing resource jointly captures both directions of driver–automation transitions with synchronized road, cabin, vehicle-control, and route observations at this scale. To fill this gap, we introduce BATON, a large-scale multimodal dataset of 781 real-world DA routes from 173 unique drivers across 108 vehicle models, spanning 204.9 hours of driving. BATON synchronizes front-view video, in-cabin video, decoded CAN (Controller Area Network) signals, radar-based lead-vehicle interaction, and GPS-derived route context into one record around each control transition.

The benchmark separates transition detection from anticipation: alongside handover prediction and an auxiliary action-recognition task, takeover is evaluated under two official protocols, onset detection (T3-D), where driver inputs are observable, and pre-override anticipation (T3-A), where every driver-override channel is withheld and windows end before the override begins. We evaluate baselines spanning gradient-boosted trees, sequence models, cross-modal and hierarchical Transformers, and a frozen V-JEPA2 video encoder; zero-shot vision–language models are also benchmarked, all under a leakage-audited protocol. Results show that i) multimodal context helps most on handover, where video world-model features raise AUPRC by 42% over the strongest tabular baseline; ii) takeover onset detection is driven largely by observable driver-input cues; and iii) under the anticipation protocol all baselines score close to the base rate, indicating that the remaining signals carry little anticipatory information, establishing BATON as a rigorous benchmark for multimodal driver–automation transition modeling.

02 · TRANSITIONS

One route, both directions

A public sample route: the driver engages the assistance system (↑ handover), drives with it, then takes control back (↓ takeover). Front camera and 10 Hz signals on one clock; the shaded stretch is the assistance system engaged; the two events are the benchmark's official ones.

● REC
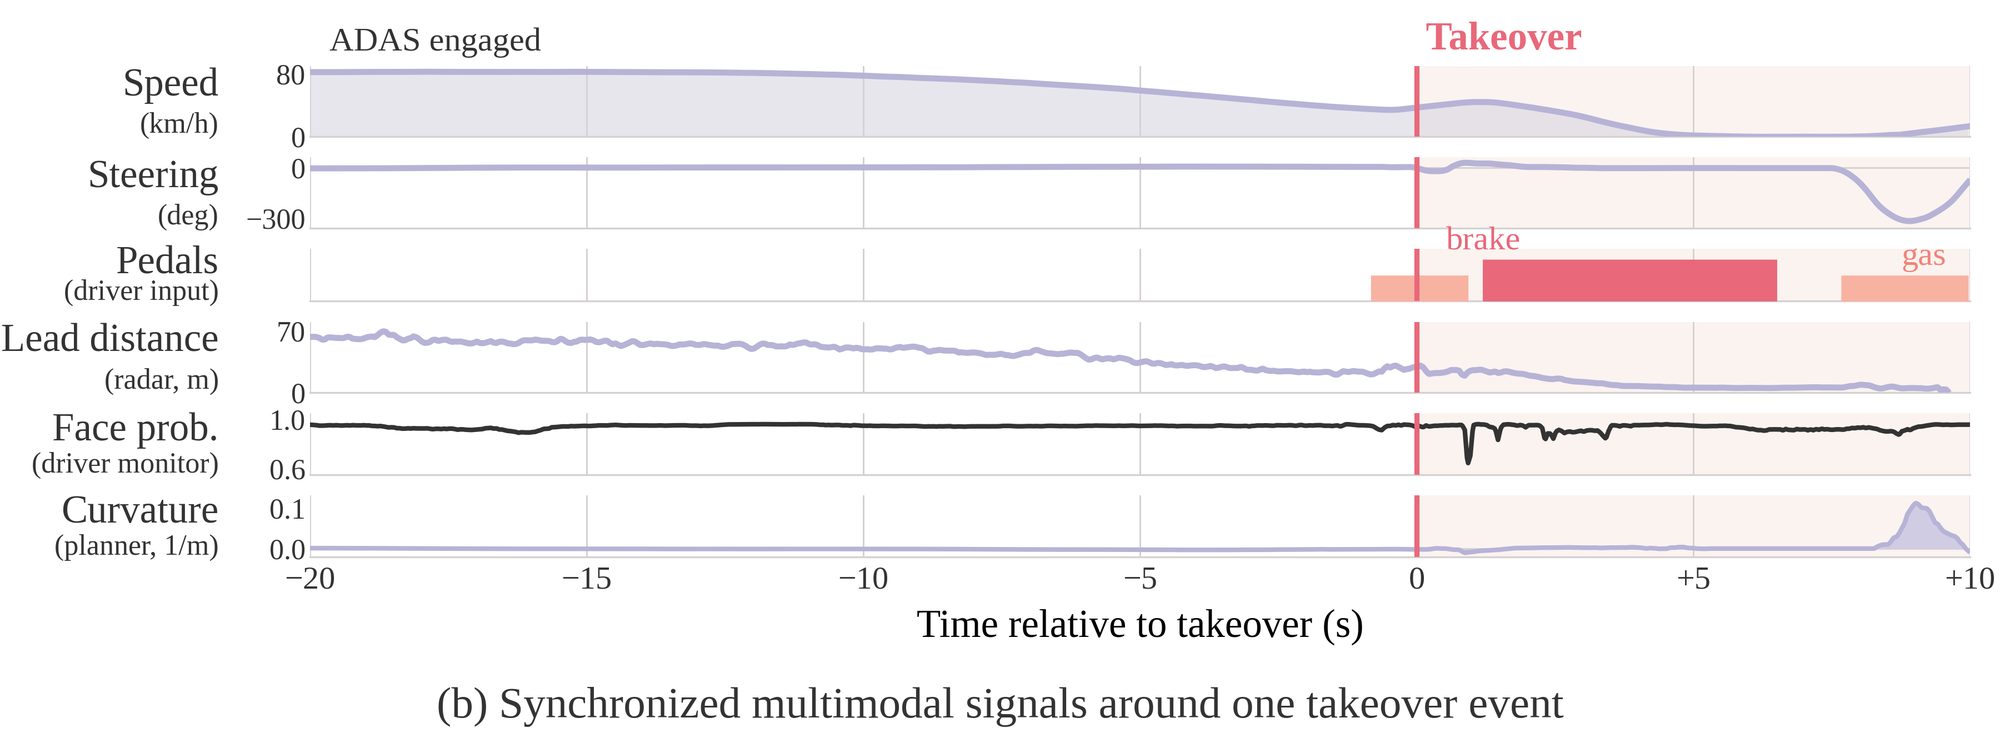
Synchronized multimodal signals around one takeover event
Static view. Synchronized signals around one takeover (paper figure).

Engagement ribbon

Timeline unavailable.

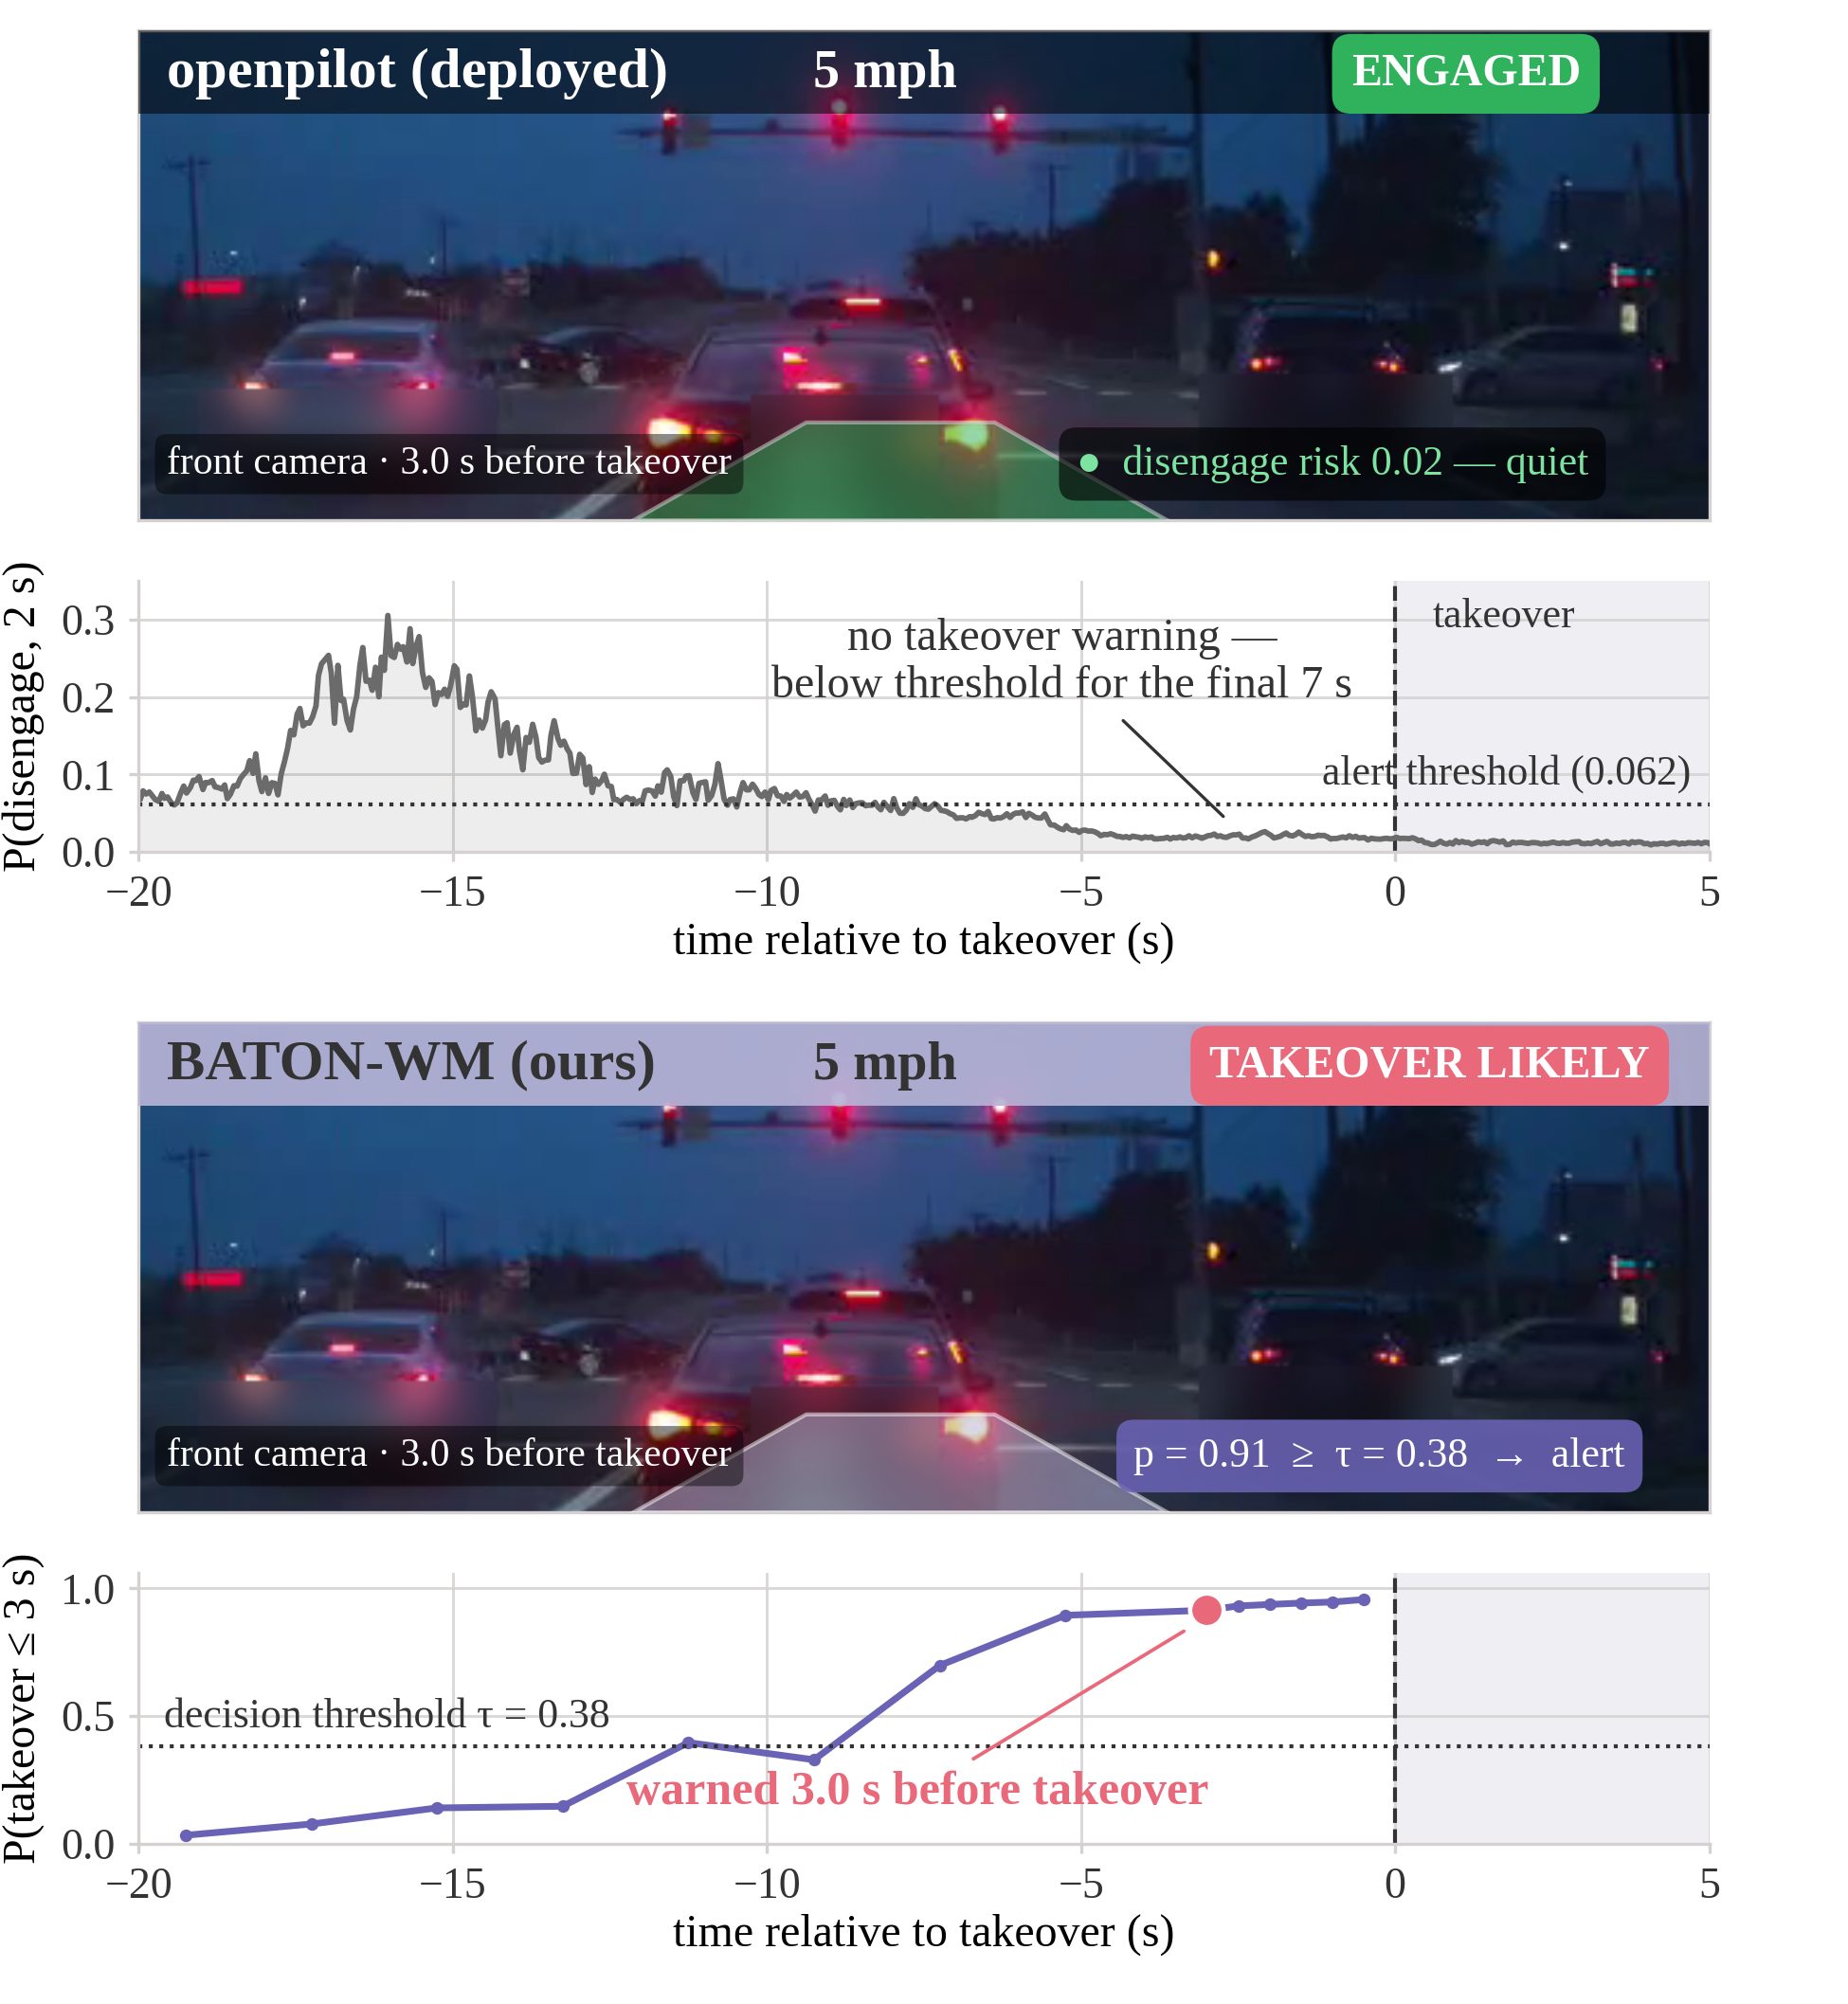
openpilot's own predictor vs BATON-WM — four takeovers

A production system already carries a disengagement predictor. The upper trace is openpilot's own probability of a disengagement within two seconds, recovered from the route logs, with its green and yellow alert levels; the step series is BATON-WM's window score with its decision threshold. Zero is the moment the driver overrides.

Front-camera frame three seconds before the override
Case study: openpilot's predictor stays quiet while BATON-WM warns three seconds before the takeover
Case 1 (paper figure).

Why takeover is scored twice

time → override (takeover onset) T3-D · 5-s window may end at the override · driver inputs visible T3-A · window ends ≥ 1 s before · override channels withheld ≥ 1 s Both: 5-s windows, 0.5-s stride, horizon h = 3 s · base rates: T3-D 0.120 · T3-A 0.035
Detection vs anticipation. Once the driver's own brake, gas, steering and the ADAS-control flags are withheld and the window stops before the override, every baseline falls to the base rate.

What the gap means

The same XGBoost readout scores 0.479 sample AUPRC on T3-D and 0.056 on T3-A; BATON-WM 0.514 and 0.070 — against base rates of 0.120 and 0.035. Observing the driver's action is most of the detection signal; anticipating it from the remaining streams is largely unsolved.

At 1 false alarm per hour, the best T3-D model recalls only 28% of takeover events (median earliest warning 3.0 s, the horizon cap); the best T2 model recalls 7% of handovers.

03 · EVIDENCE

What the numbers rest on

.514 T3-D sample AUPRC · base rate .120

Takeover onset detection: 4.3× the base rate, carried by observable driver inputs.

Cross-driver, h = 3 s, 3-seed mean; bar = sample AUPRC, second value = event AUPRC. The CAN-statistics XGBoost (.479) beats every neural multimodal model; adding driver pose makes BATON-WM (.514).

Main results table in the paper.
.335 T2 sample AUPRC · +42 %

Handover prediction is where multimodal context helps most.

Video world-model features raise the tabular baseline from .236 to .335 (+42 %); base rate .148. Handovers depend on immediate context — the road ahead — more than on the driver's hands.

Main results table in the paper.
.070 T3-A sample AUPRC · base rate .035

Anticipation is 2.0× the base rate — honest, and small.

With every driver-override channel withheld and windows ending before the override, all baselines stay within .033–.070. Distillation from a detection teacher that sees the override during training does not lift it meaningfully. The remaining signals carry little anticipatory information.

Base rates: T2 .148 / .037 · T3-D .120 · T3-A .035 (sample / event). Operating point: at 1 false alarm per hour, the best T3-D model recalls only 28% of takeover events (paper v2).

.293 vs .771 sample AUPRC

A deployed predictor leaves most of the task unsolved.

openpilot's own disengagement predictor, scored on the 26 benchmark routes where its outputs exist (5 in the test split): .293 / .101 sample / event AUPRC on T3-D, above the .122 base rate but far below the tabular baseline on the same rows (.771 / .732) (paper v2).

Case 1: openpilot quiet, BATON-WM warns 3 s before the takeover
Case 1 — openpilot quiet below its alert threshold; BATON-WM crosses τ = 0.38 three seconds before the override (paper figure).
781 → 565 routes · corpus → frozen benchmark

Scope, stated plainly.

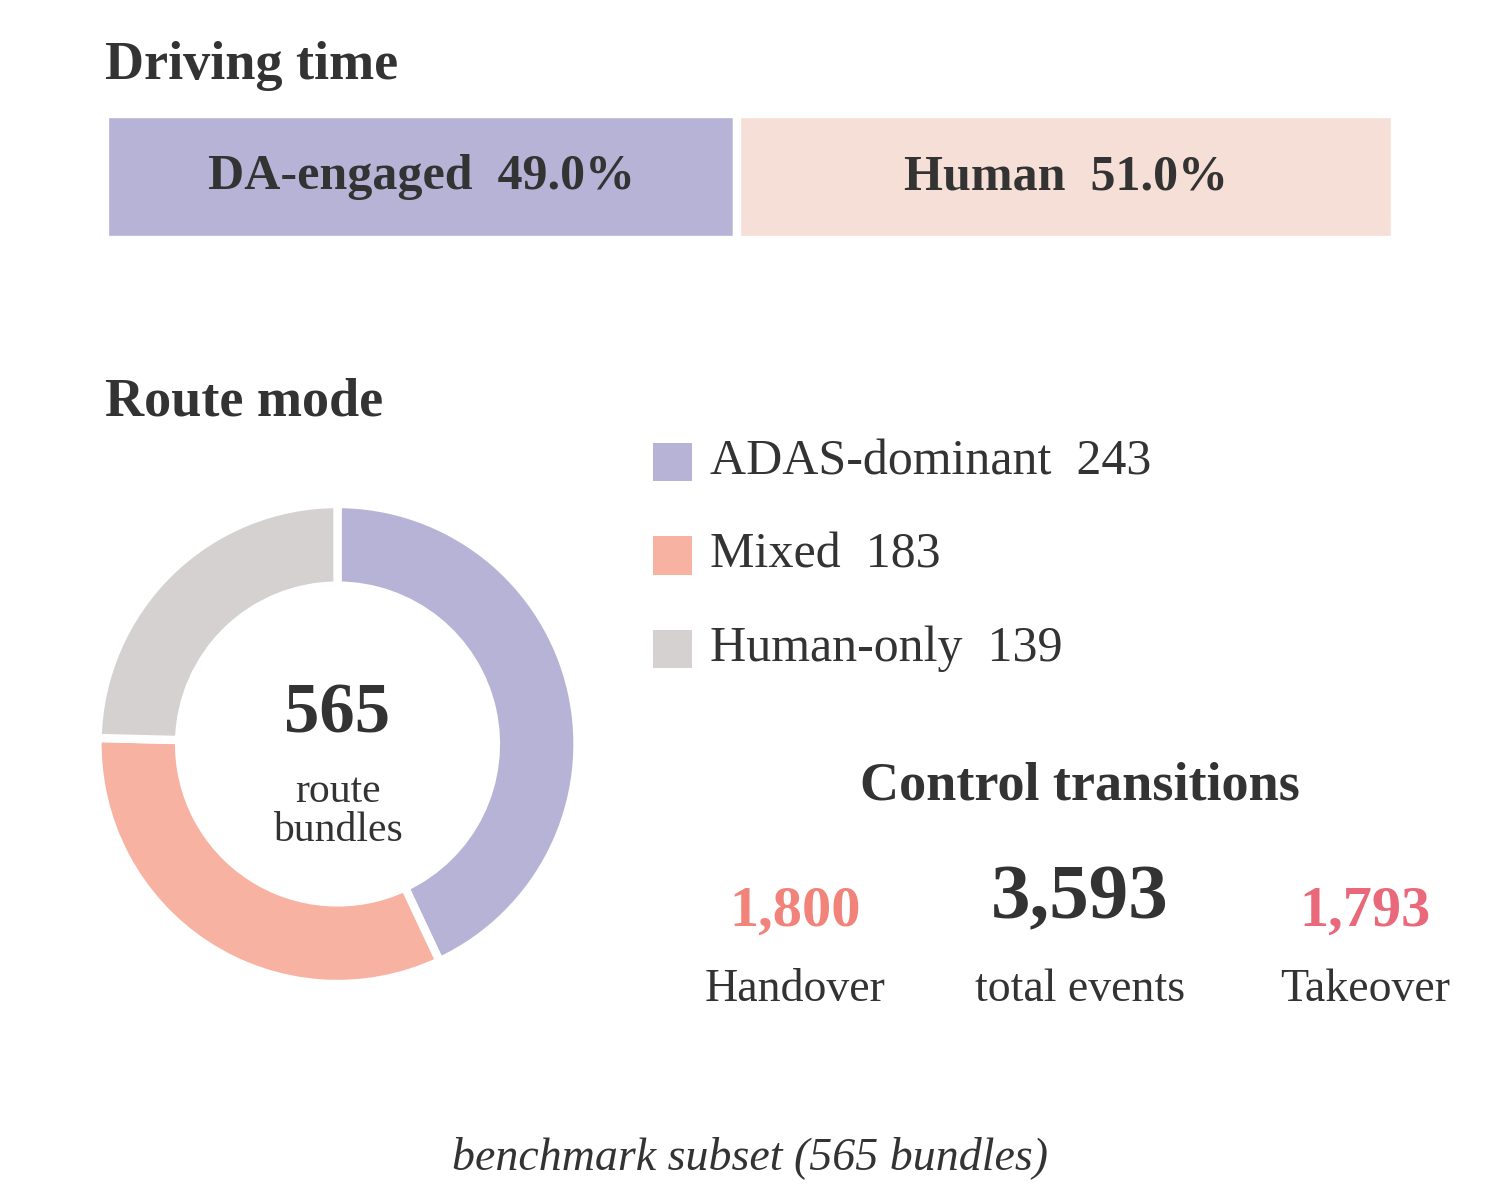
The corpus: 781 routes, 173 drivers, 108 models, 204.9 h; the benchmark is defined on a frozen, quality-filtered subset of 565 route bundles (162.1 h, 150 drivers, 99 models) with 3,593 events — 1,800 handovers and 1,793 takeovers. Two scope facts from the paper: a single configuration accounts for 96% of all transitions (openpilot lateral + stock adaptive cruise), and because each driver drives their own vehicle, the cross-driver split measures driver and platform generalization jointly.

Driving time split, route modes and control-transition counts of the benchmark subset
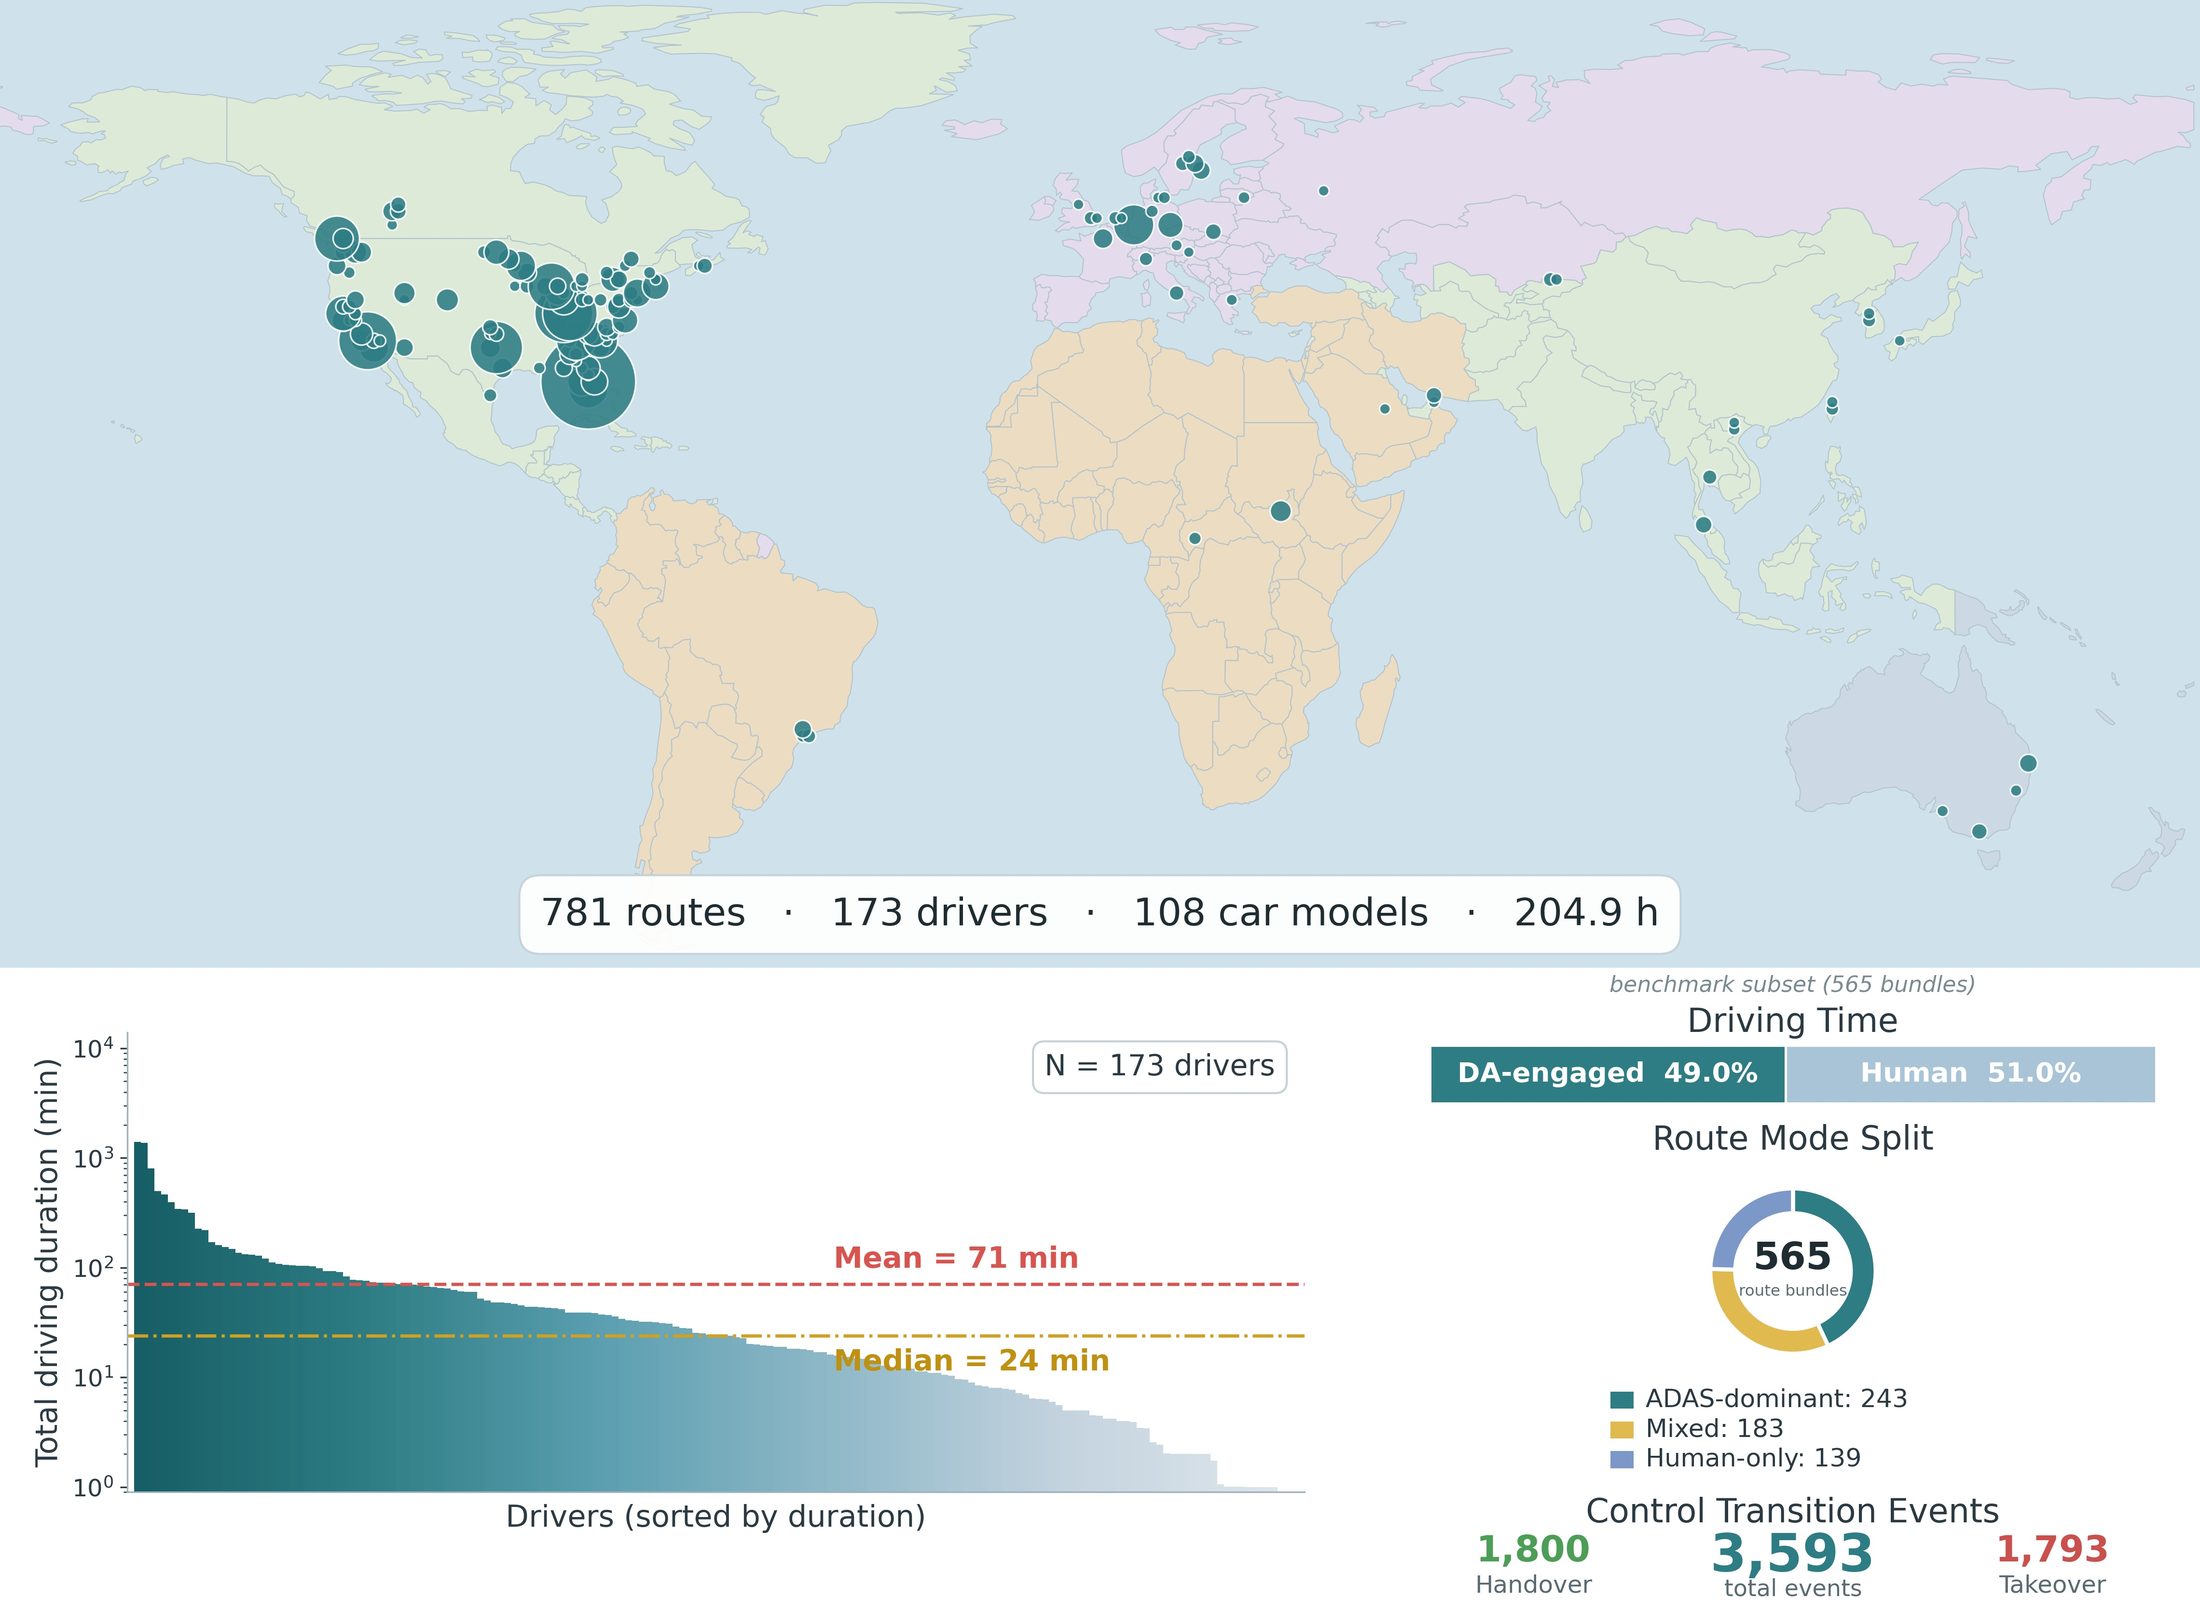
Benchmark subset. 49.0 % DA-engaged driving; 243 ADAS-dominant / 183 mixed / 139 human-only routes; 1,800 ↑ / 1,793 ↓.
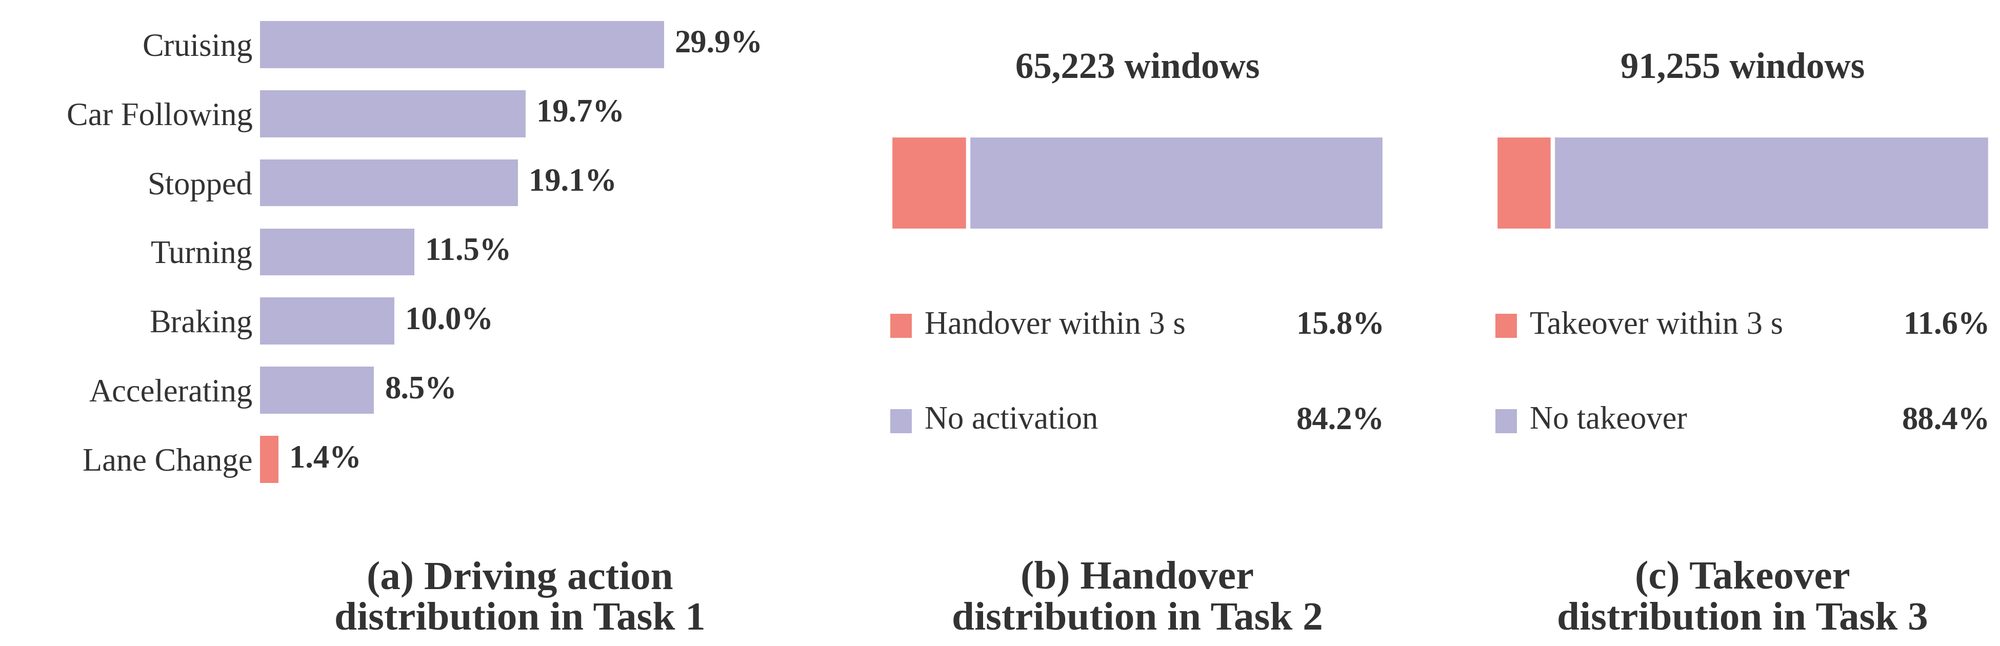
Task label distributions: driving actions, handover and takeover positives
Tasks. T1 seven action classes; T2 65,223 windows (15.8 % positive); T3 91,255 windows (11.6 % positive).
04 · METHOD

Plug-and-play recording, synchronized record

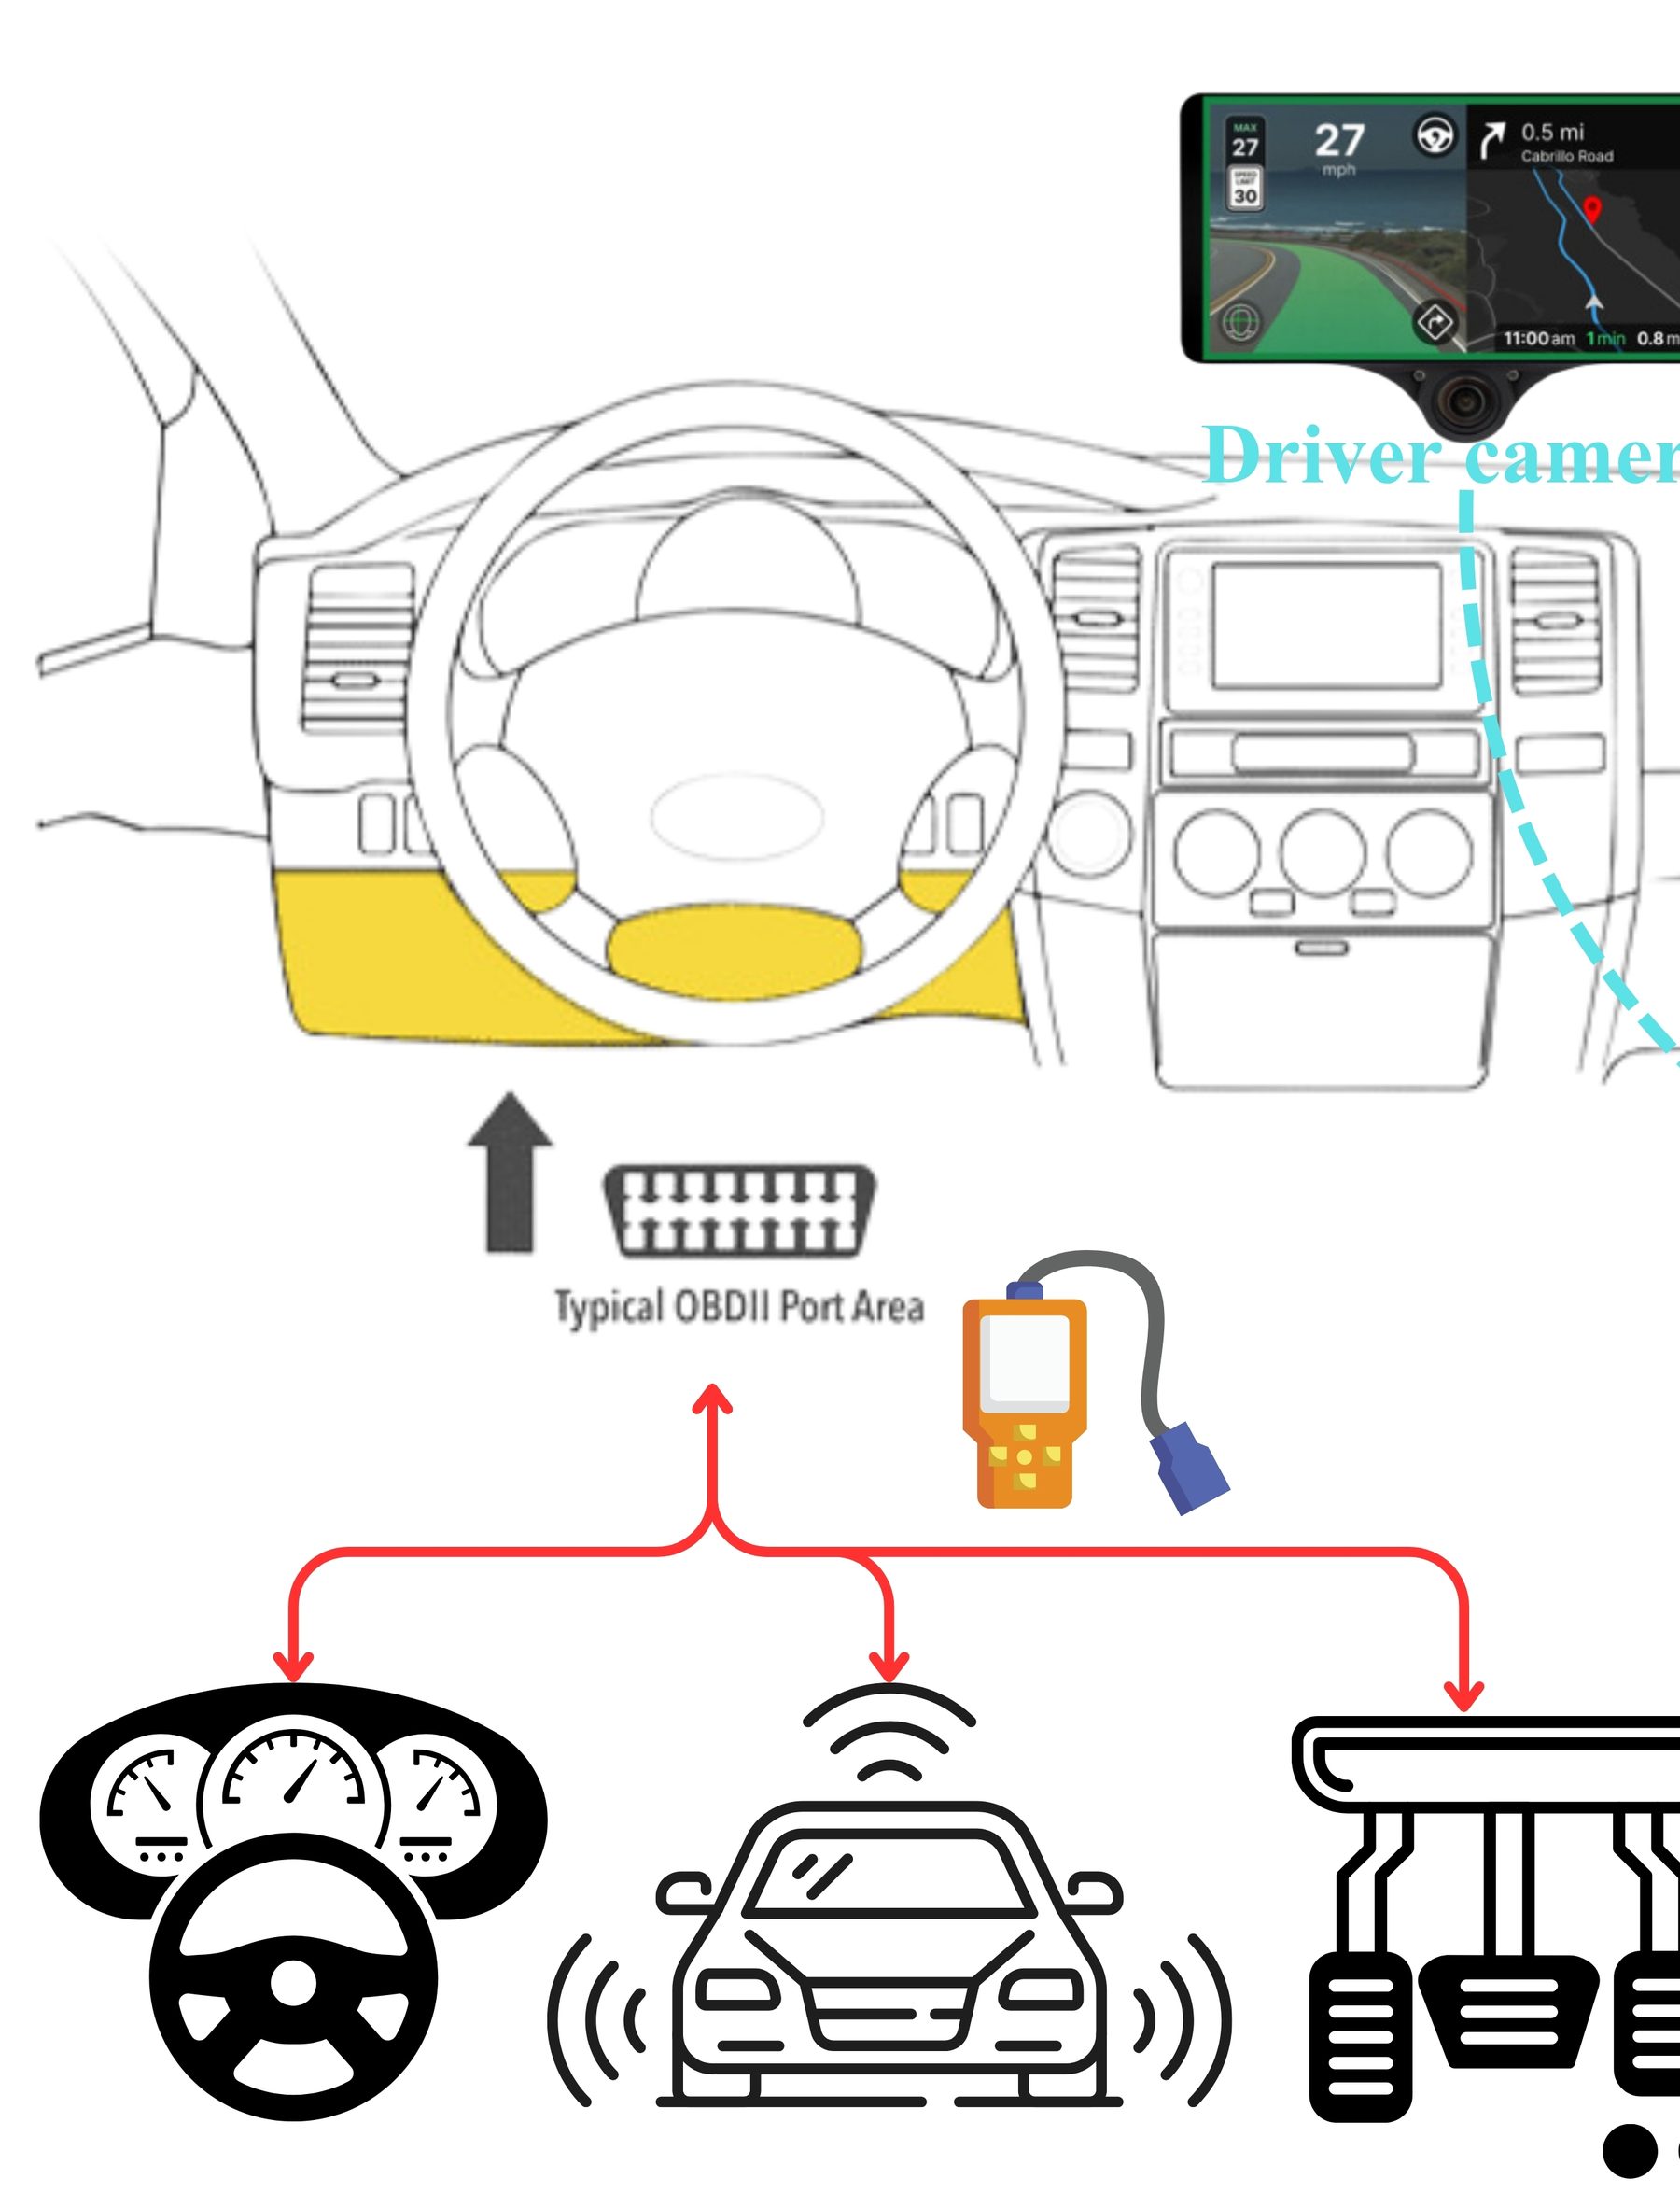
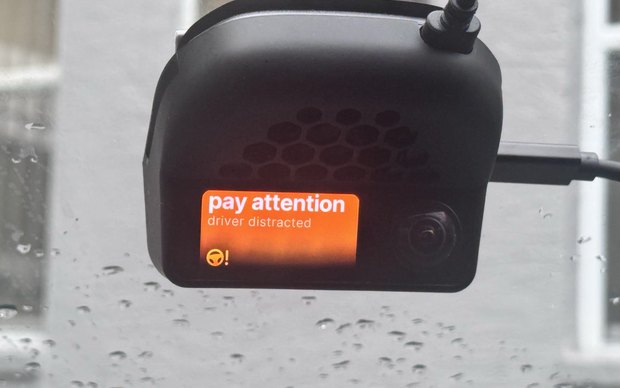
A dash-mounted recorder on the driver's own car logs road and cabin video, decoded CAN, radar, the driver monitor and the planner; every control transition becomes one time-aligned record. The benchmark freezes the subset, the splits and a leak-safe field list.

Synchronized multimodal signals around one takeover: speed, steering, pedals, lead distance, face probability, curvature
One takeover, every stream. Speed, steering, pedals, lead distance, driver-monitor face probability and planner curvature around a takeover (paper figure; this one is from the lab's own consented recorder).
Recording setup: OBD-II dongle, CAN, pedals, steering and the dash-mounted recorder
Setup. Non-intrusive OBD-II dongle + dash recorder (schematic; cabin view and street map cropped out).
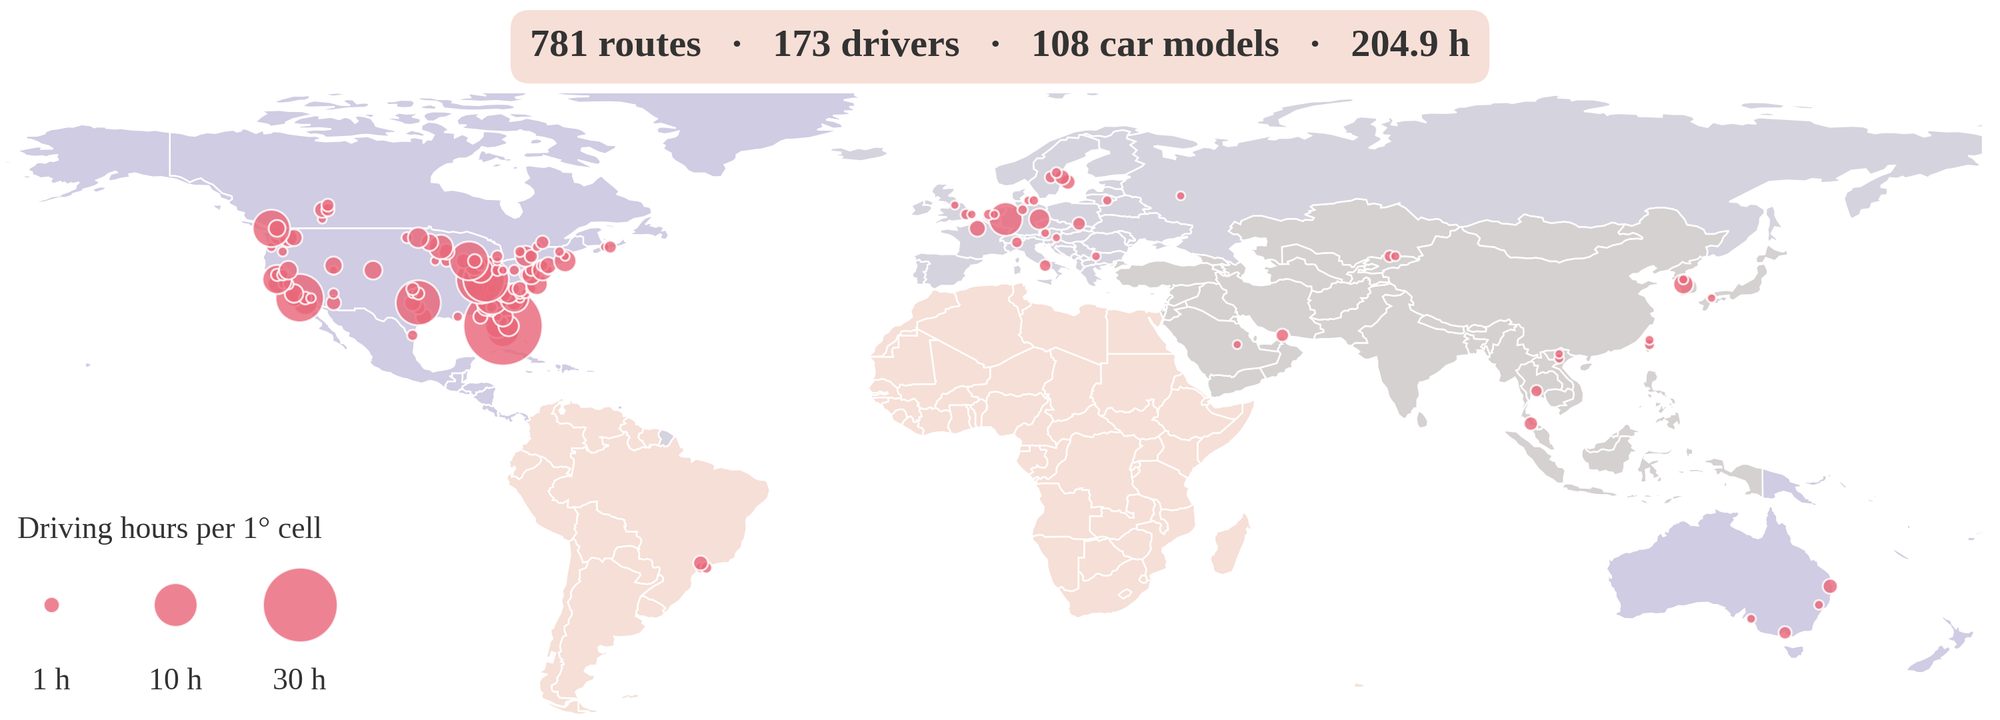
World map of driving hours per one-degree cell
Where. Driving hours per 1° cell; coordinates are released only at route level under the gated license.
Dataset overview: global distribution, per-driver duration and event breakdown
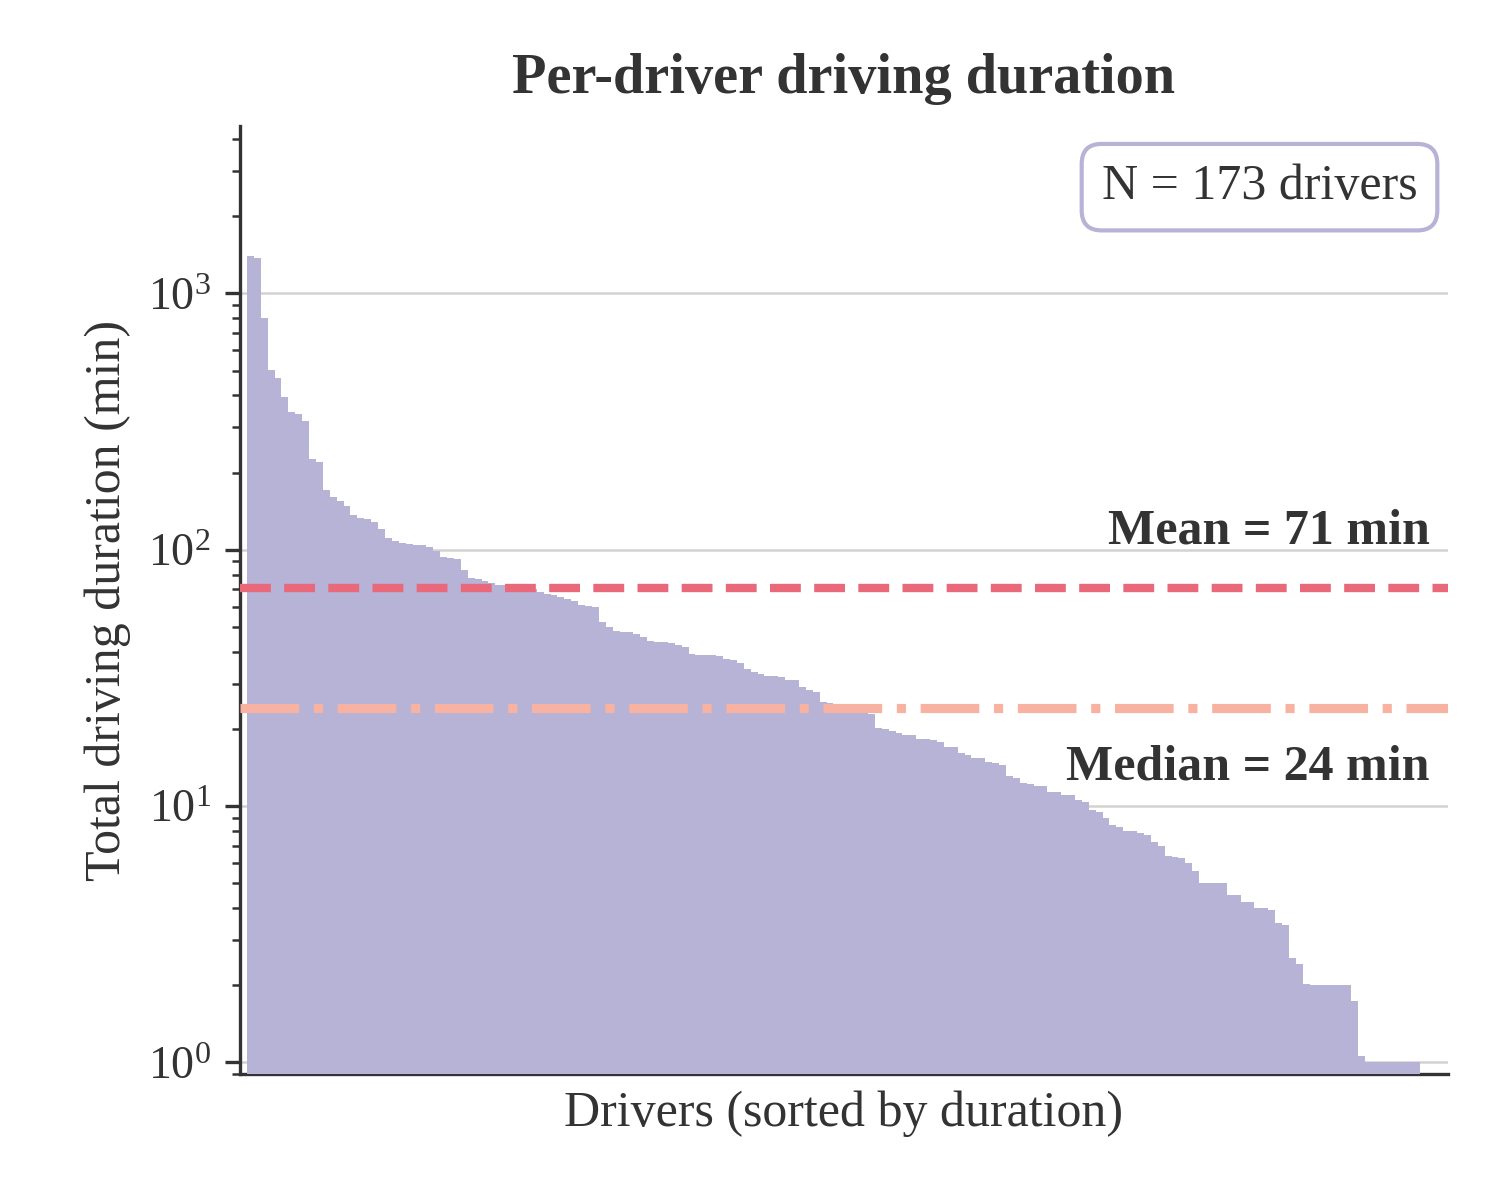
Overview. Global distribution, per-driver duration (mean 71 min, median 24 min) and the event breakdown.
Per-driver driving duration, 173 drivers
Drivers. 173 drivers, long-tailed: a few drive for hours, most for minutes.
05 · RESULTS

Tables, baseline first

Main transition results · cross-driver · h = 3 s · sample / event AUPRC · 3-seed mean · arXiv v2

MethodInputT2 handoverT3-D takeover detectionT3-A anticipation
Base rate—.148 / .037.120 / —.035 / —
GRUstruct.202 / .072.280 / .119—
TCNstruct.190 / .058.332 / .167—
Cross-Modal Transformerstruct.242 / .103.316 / .135—
V-JEPA2 fusionvideo + struct.235 / .089.329 / .161—
RG-HBT-Qstruct + video.254 / .111.398 / .230.058 / .026
DI-RG-HBT-Qstruct + video.219 / .116.366 / .215—
XGBoostCAN statistics.236 / .103.479 / .380.056 / .026
BATON-WMmultimodal.335 / .171.514 / .413.070 / .040

Honest limits. 96 % of transitions come from one assistance configuration; drivers drive their own vehicles, so driver and platform generalization are measured jointly; anticipation (T3-A) stays near the base rate for every baseline; the four case studies are hand-picked and openpilot predictions exist for only 26 routes.

Sources & notes
    06 · DATA & ACCESS

    Get the routes

    Auto-approved

    BATON-Sample

    Two drivers, 45 routes, all nine modalities — including the in-cabin video, under the same license. The clip on this page is one of these routes (front camera only).

    as of 2026-10-02 · gated: auto · CC BY-NC 4.0

    On request

    BATON · frozen benchmark

    565 routes · 162.1 h · 150 drivers · 3,593 events; benchmark protocol, splits and leak-safe field list included.

    as of 2026-10-02 · gated: manual · CC BY-NC 4.0

    Open

    Code

    Baselines, the leakage-avoidance protocol and the event definitions on GitHub.

    “This dataset is released for academic research use only under CC BY-NC 4.0.”Hugging Face dataset card · fetched 2026-10-02

    Terms. Non-commercial research use; no re-identification; the in-cabin video stays under the gated license and is never redistributed in the open; cite the paper.

    07 · CITE

    Read the paper, cite the benchmark

    BibTeX
    @article{wang2026baton,
      title   = {BATON: A Multimodal Benchmark for Bidirectional Automation Transition Observation in Naturalistic Driving},
      author  = {Wang, Yuhang and Xu, Yiyao and Yang, Chaoyun and Li, Lingyao and Sun, Jingran and Zhou, Hao},
      journal = {arXiv preprint arXiv:2604.07263},
      year    = {2026},
      note    = {arXiv:2604.07263v2}
    }

    Related work from the lab