Skip to content

Dataset & benchmark · driving style · arXiv 2026

DriveDNAA Large-Scale Multimodal Naturalistic Driving Dataset and Benchmark for Driving Style Identification

The first benchmark designed to distinguish driver behavior from vehicle, drive and driving-condition shortcuts — and to show when a high re-identification score is really a route shortcut.

4,121 drives from 465 drivers across 115 vehicle models, 975 hours of human-controlled driving at 10 Hz with forward video. Frozen driver-disjoint splits, condition-matched pairs and leakage probes ship with the data, so every score comes with the question "how much of this is the person?"

arXiv 2607.23822 · 202662,674 windows · 276,248 events30 baseline configurations

Yuhang Wang1·Lingyao Li2·Hao Zhou1

1University of South Florida · MOTIF-Lab   2University of Arizona

t-SNE map of driving-window embeddings
live · 14,930 windows · 428 drivers · t-SNE of 128-d embeddingsdriver map
01 · OVERVIEW

Driving style, isolated from its confounds

The abstract, verbatim, beside what you need to know at a glance.

DriveDNA operationalizes driving style as a consistent, driver-specific behavioral pattern in how a vehicle moves under similar conditions, and isolates it from vehicle identity, route, and environment confounds. It contains 4,121 drives from 465 drivers across 115 vehicle models — 975 hours of human-controlled driving at 10 Hz with forward video — plus 62,674 annotated 60-second windows and 276,248 maneuver events. The benchmark defines three tasks: few-shot driver re-identification, personalized behavior prediction, and condition-matched comparison. Learned representations outperform classical descriptors on unseen drivers (AUROC 0.935 vs. 0.707), but video-only models are vulnerable to "route leakage" — strong scores can stem from contextual shortcuts rather than genuine behavior — motivating robustness-aware evaluation with frozen splits, leakage diagnostics, and 30 baseline configurations.

02 · SIGNATURE

Same car, same curve, two drivers

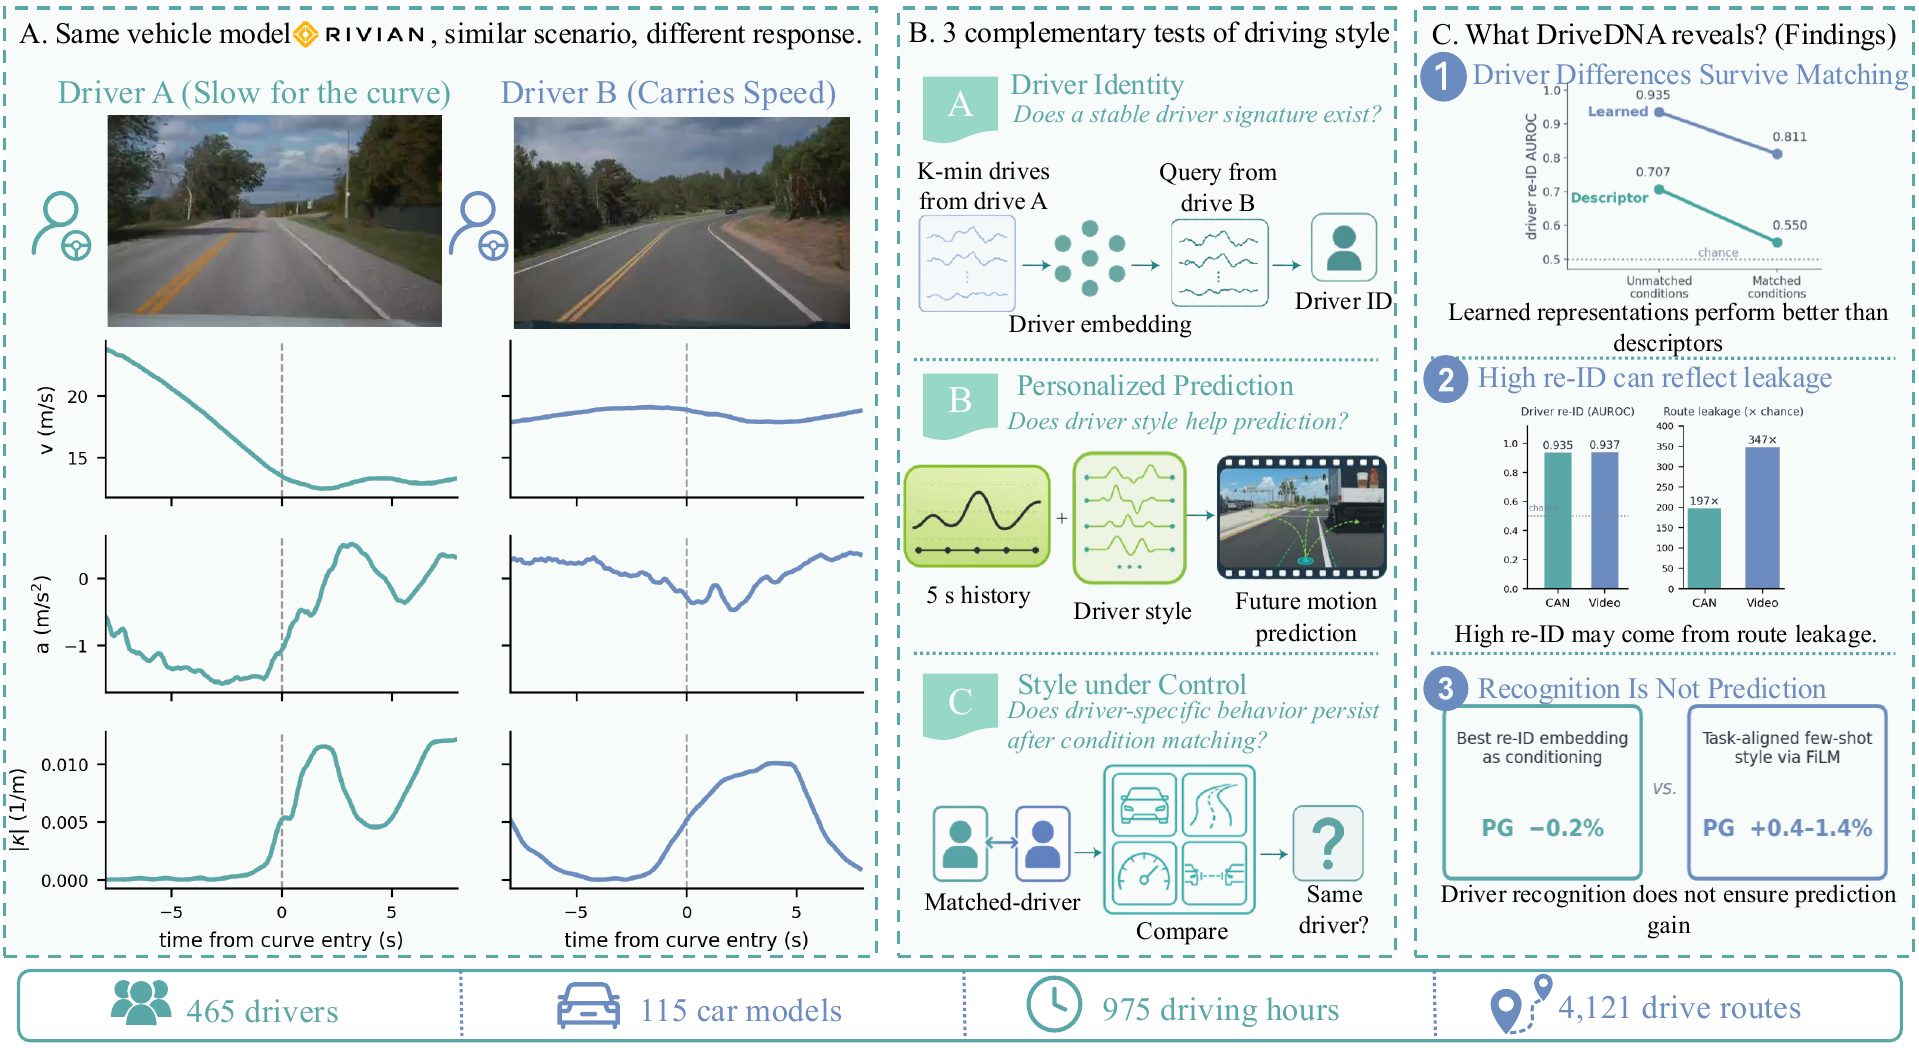
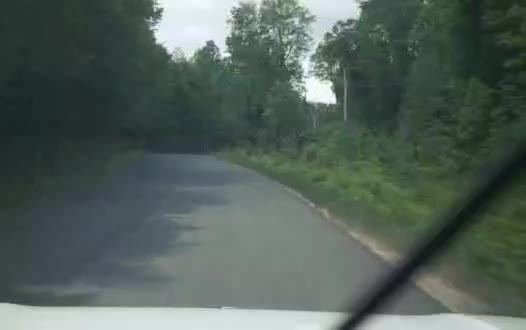
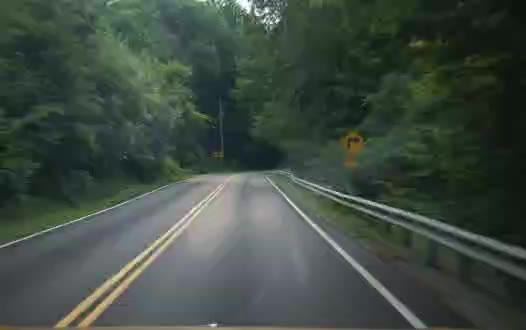
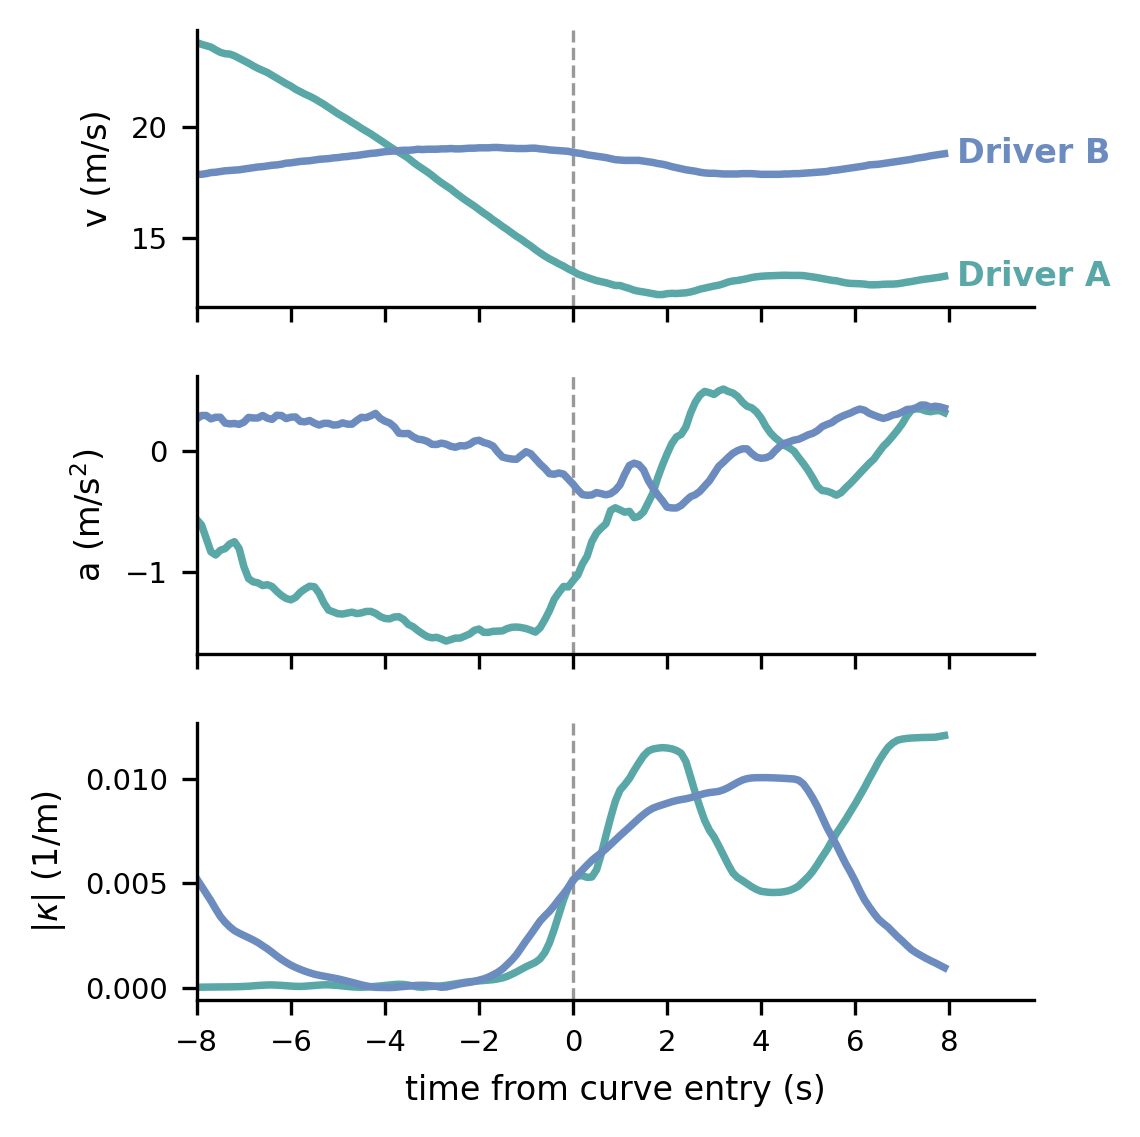
Driving style only means something once the car and the road are held fixed. Each pair below is two drivers in the same vehicle model entering a matched curve: A in violet, B in white, on the same axes, eight seconds either side of the anchor.

Forward camera frame for driver A at the anchor
A
Forward camera frame for driver B at the anchor
B
Two drivers' speed, acceleration and curvature traces overlaid around a matched curve
Static view. Overlaid traces from the paper's matched-pair figure.

The driver map — and what it is actually reading

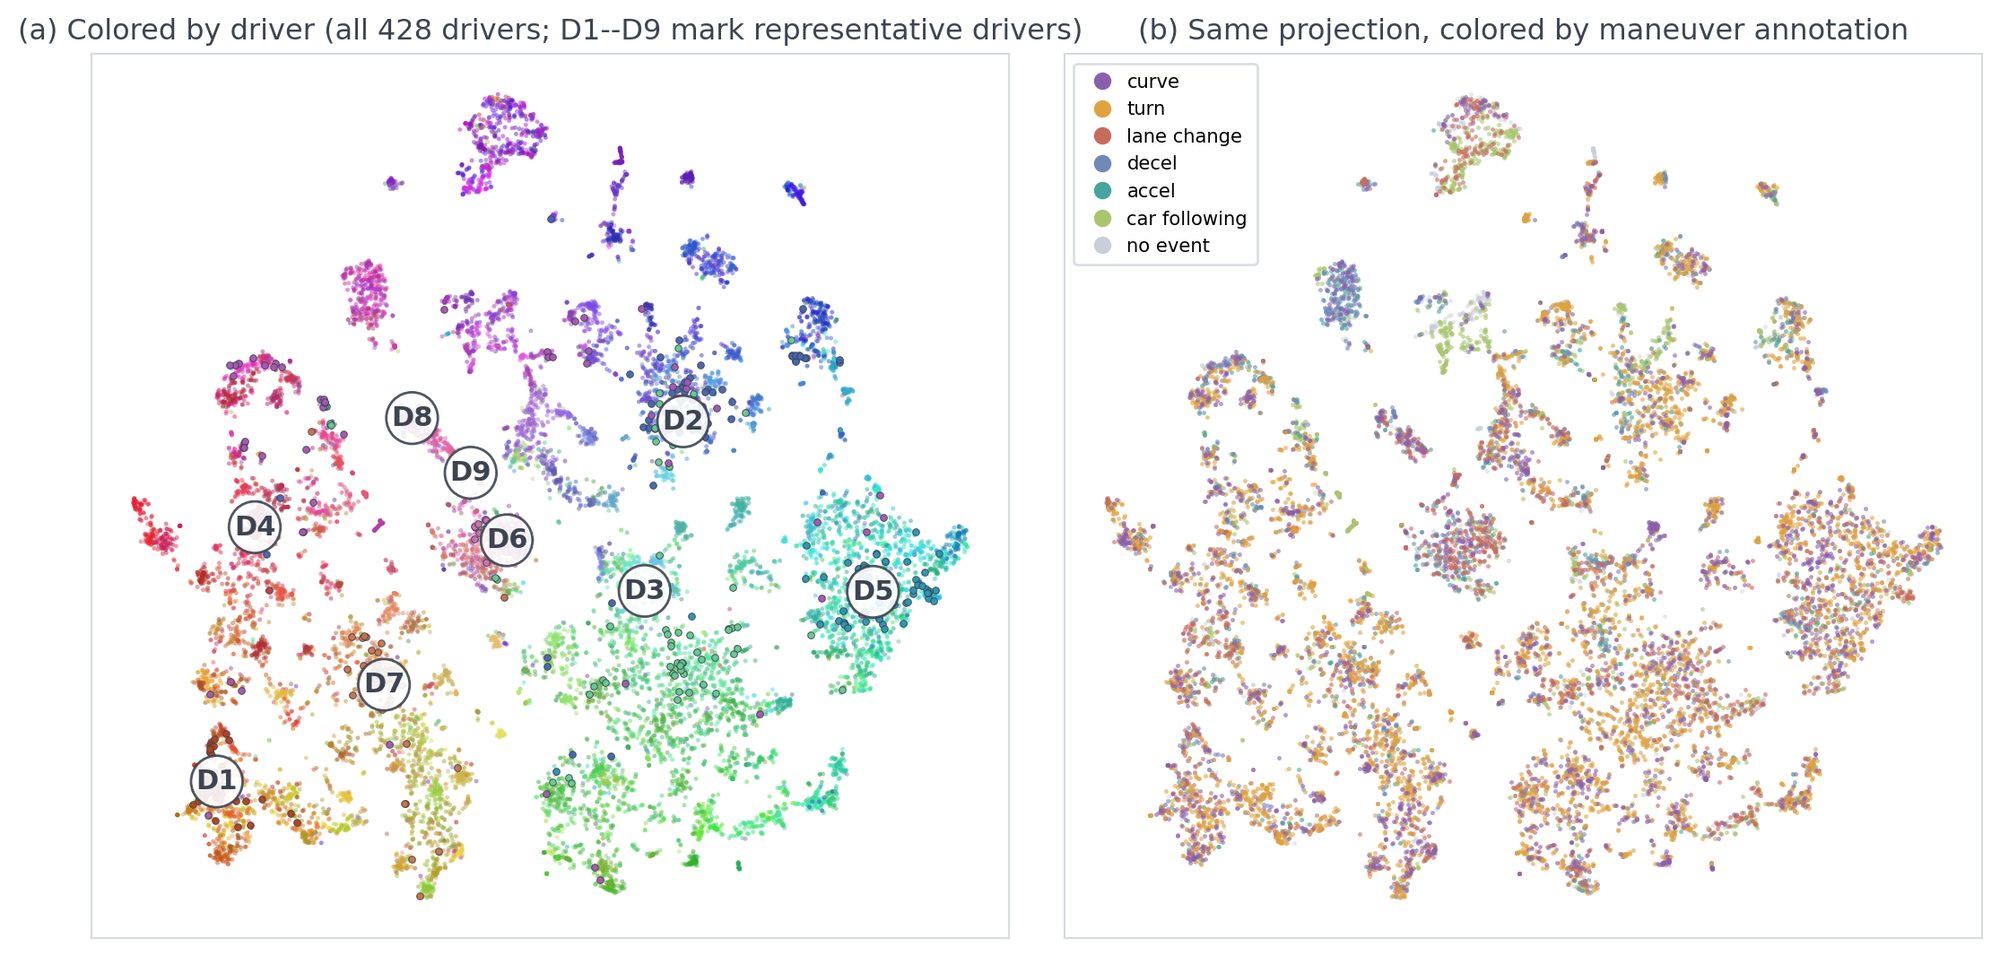
14,930 windows (≤ 60 per driver, 428 drivers) embedded by the PatchTST + SupCon encoder and projected with t-SNE. Colour by driver, vehicle model or scenario; hover or click a point to light up its category; ←/→ walks through representative drivers. The purity chips give the k = 10 nearest-neighbour label agreement on the 128-d embeddings: if neighbours share a model or a scenario more than a driver, the embedding is reading the car or the road, not the person.

t-SNE map of driving-window embeddings coloured by driver
Embedding map (paper figure).

Read the purity honestly. On this map neighbours agree on the vehicle model (0.58) more often than on the driver (0.49) or the scenario (0.46). That is the point of the benchmark, not an embarrassment for it: a strong re-identification score can be carried by the car and the context, which is exactly what the condition-matched task and the leakage probes measure.

03 · EVIDENCE

What the numbers rest on

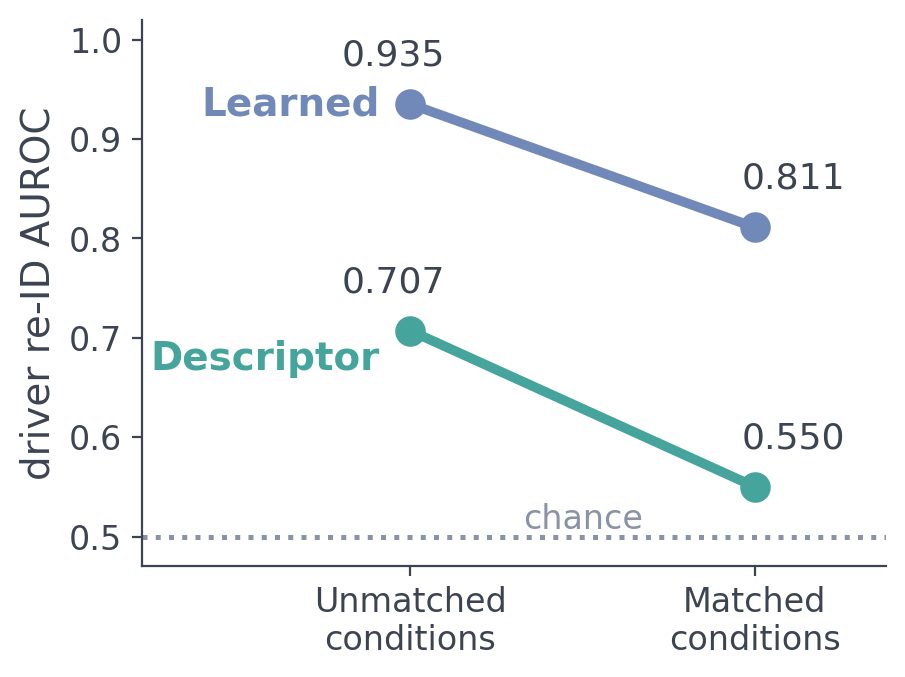
.935 → .811 AUROC, unmatched → condition-matched

Hold the car, the scenario and the speed regime fixed, and every representation loses — the video-only probe loses most.

Each dumbbell runs from AUROC on unseen drivers (hollow) to AUROC on the 14,868 condition-matched pairs (filled). Classical descriptors fall to chance (.707 → .550). The video-only probe drops from .937 to .675, the largest drop of any representation; the learned CAN encoder holds at .811 ± .006 across all six scenario types.
AUROC before and after condition matching for every representation
Condition-matched collapse (paper figure).

Story rows at full opacity; the rest dimmed. Table 3 of the paper (paper); "every zero-shot foundation model falls to chance or near it (.55–.60)".
347× chance

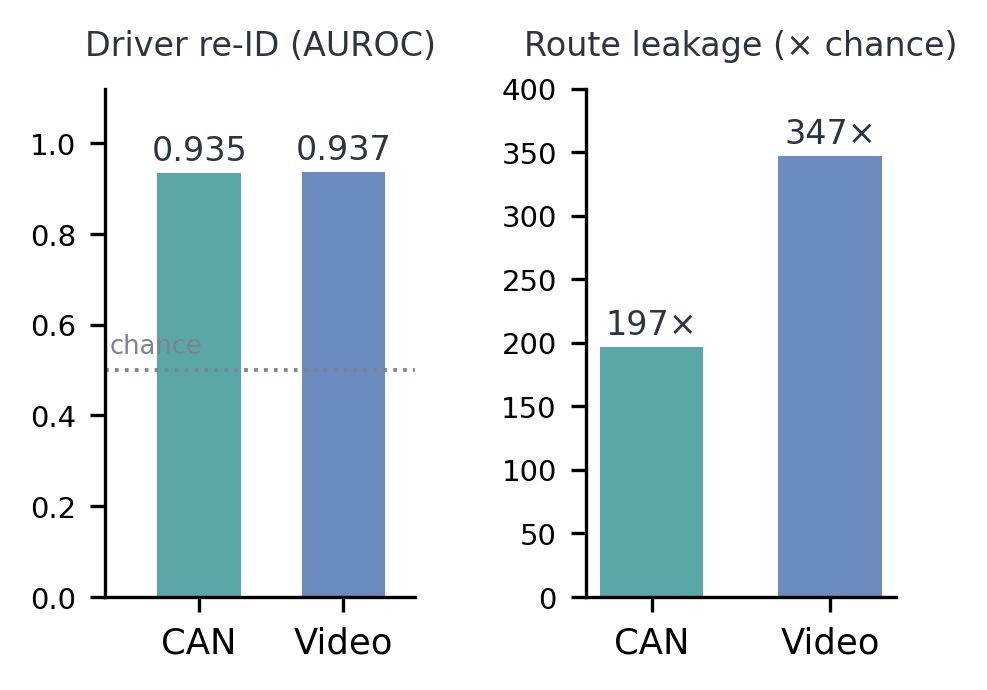
The video representation predicts the route — far better than it should if it were reading the driver.

Leakage probes: a probe on the video representation predicts the route at 347× chance (CAN: 197×) and the vehicle at 64× (CAN: 56×). Strong scores can stem from contextual shortcuts; the benchmark asks users to report leakage alongside utility.

Video representations predict the route far above chance
Route leakage (paper figure).
.935 vs .707 AUROC

Learned embeddings beat classical descriptors on unseen drivers — by a margin three to six times the seed noise.

Five-minute enrollment, unseen drivers: descriptors .707; supervised contrastive PatchTST .935 ± .005 with top-1 identification at about 33× chance. Label-free pretraining closes most of the gap (masked reconstruction .907); frozen foundation models land at or below the descriptor level (MOMENT-1 .636, Qwen3-4B text .596).

Table 2 in the paper.
62,674 windows · 276,248 events

Annotated at the window and the manoeuvre level, audited by people.

60-second windows from 428 drivers (355 in frozen folds), six scenarios, eight behavioral primitives with 93.0 % audit agreement; 276,248 manoeuvre events including 22,322 individually verified lane changes. Six 10-second audit clips below, one per class, forward camera only.

lane change
deceleration
curve
+0.8 % at 5 s · k = 5

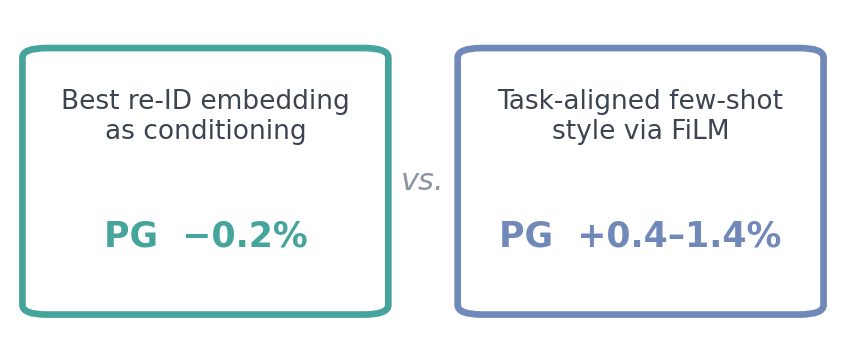
Identity translates into a small, consistent prediction gain.

Few-shot personalization improves behavior prediction on unseen drivers in all three seeds, with the gain concentrated at short horizons (positive at 1–5 s; +0.8 ± 0.5 % at the 5 s horizon with five support windows). Honest size: it is a gain, not a leap.

Identity signal versus prediction gain
Identity vs prediction (paper figure).
04 · METHOD

How the benchmark is built

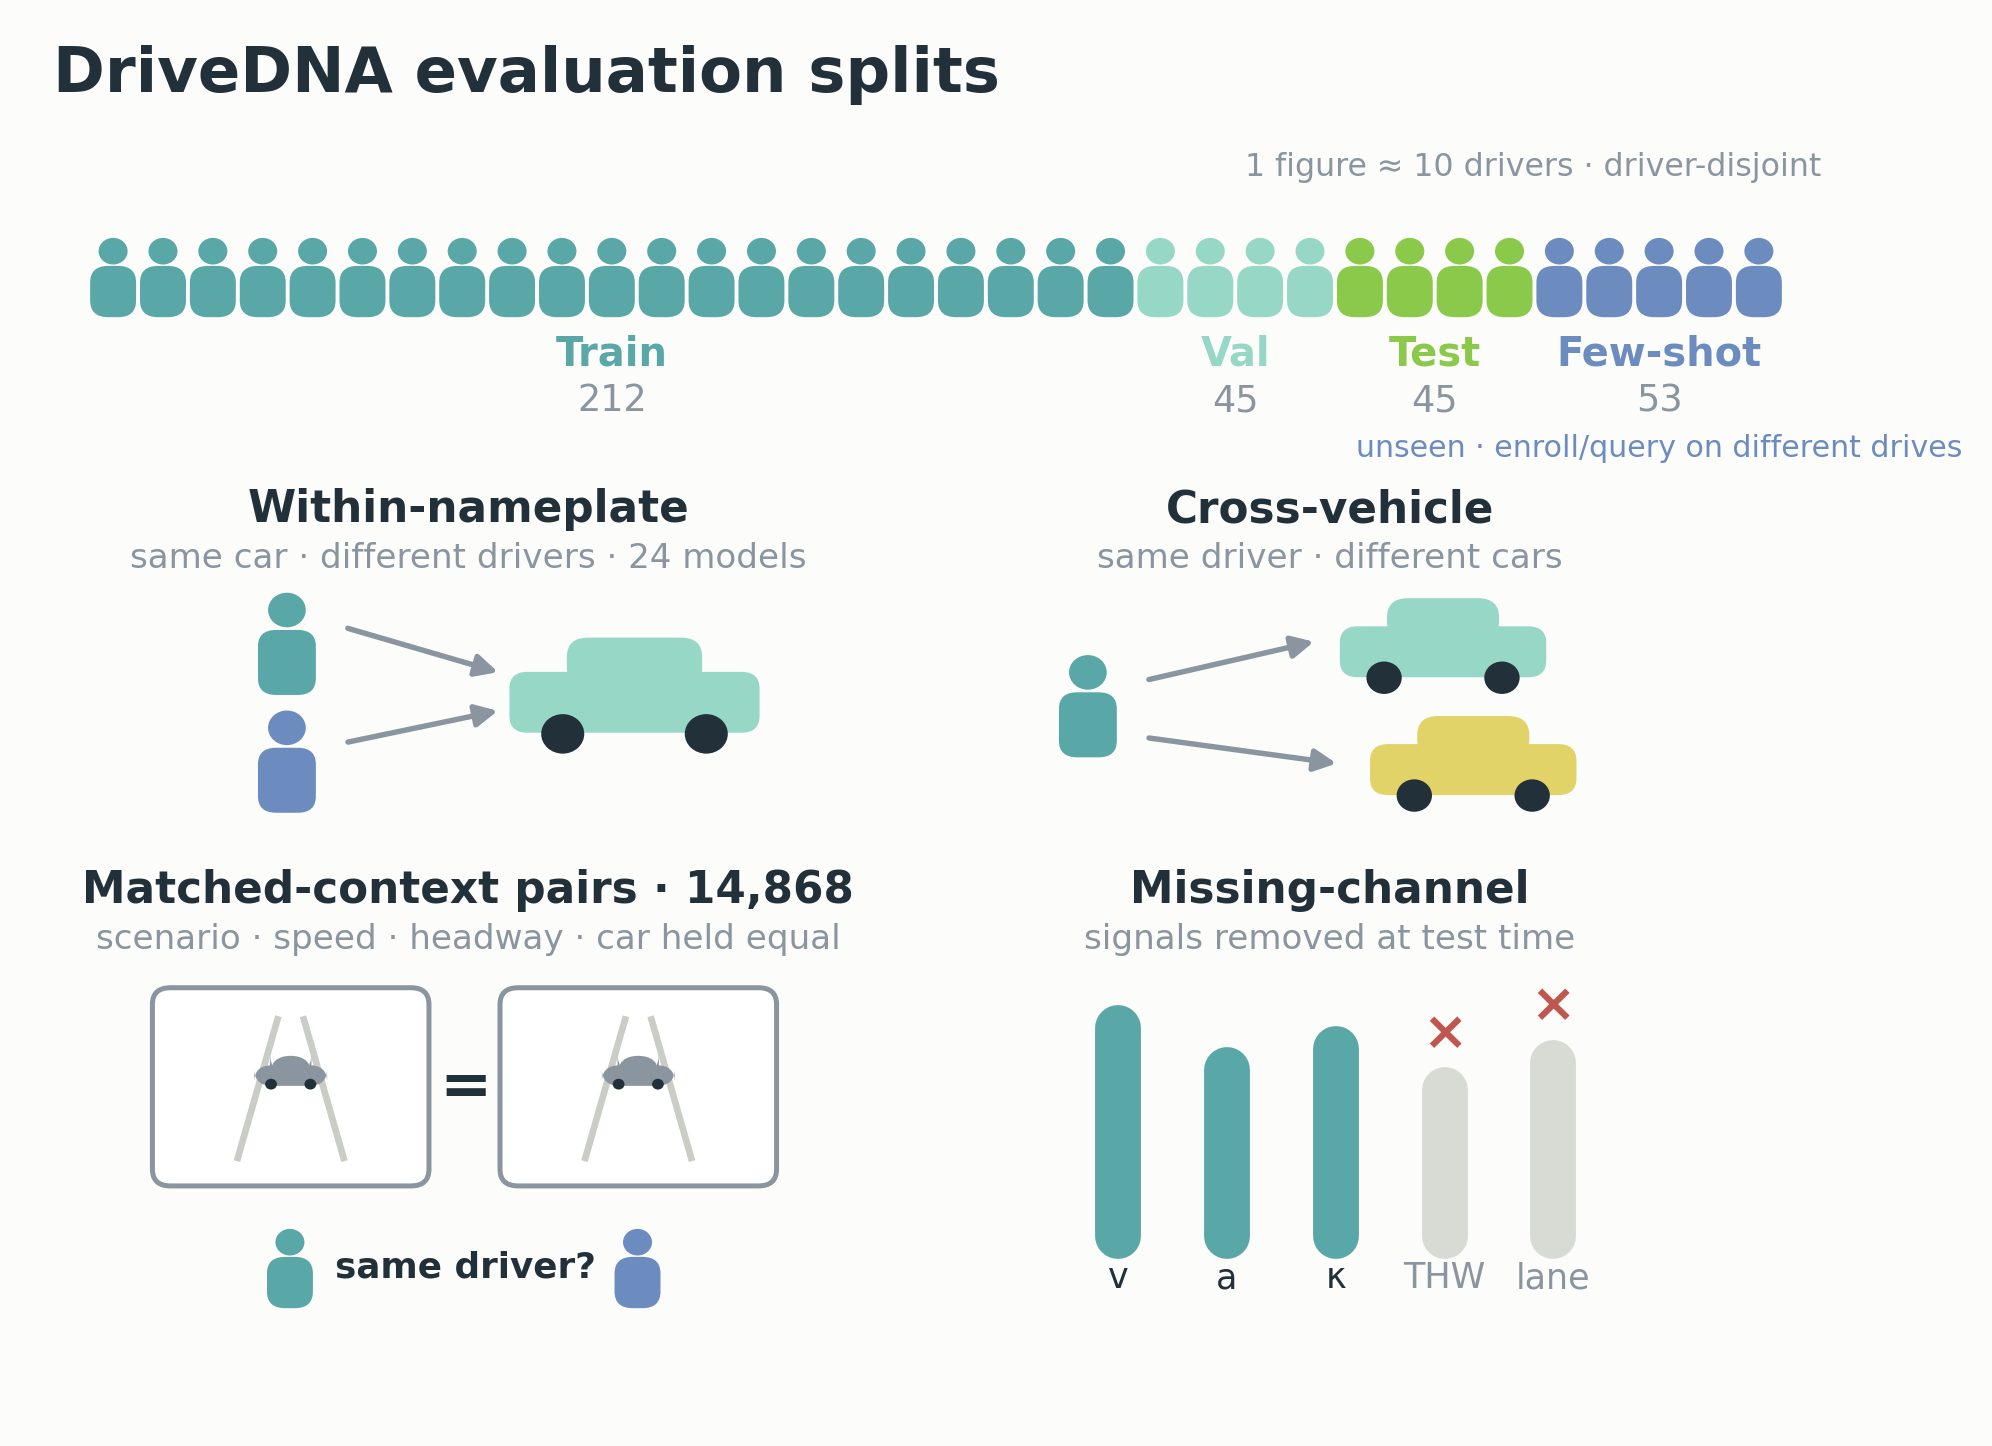
Human-controlled driving only; 60-second windows tagged with scenario and primitives; driver-disjoint frozen folds; condition-matched pairs on vehicle model, scenario and speed regime; leakage probes for route and vehicle.

DriveDNA overview: corpus, windows, tasks and leakage diagnostics
Overview. Corpus → windows → three tasks → diagnostics (release figure).
Split schematic: driver-disjoint folds and the condition-matched protocol
Splits. Driver-disjoint frozen folds; matched pairs hold the vehicle model, scenario and speed regime fixed.

Three tasks

Re-identification — k-minute enrollment → identity (Top-k, AUROC, EER). Personalized prediction — 5-s history → 1–5-s future motion (RMSE, personalization gain). Condition-matched comparison — same model, scenario and speed: is it the same driver?

Thirty baseline configurations: descriptors, zero-shot foundation models, label-free SSL, CLIP-aligned CAN, video-only probes, supervised contrastive encoders — with three-seed error bars.

05 · RESULTS

Tables, baseline first

Driver re-identification with 5-minute enrollment on unseen drivers · arXiv v1

RepresentationAUROC ↑EER ↓Top-1 ↑
Descriptors (anchor).707.349.09
Qwen3-4B text encoder (zero-shot).596.431.05
Llama-3.2-3B text encoder (zero-shot).598.428.05
MOMENT-1 (zero-shot).636.408.08
CLIP-aligned CAN (no labels).831.244.21
JEPA-style SSL + probe.878.197.20
Masked-TS SSL + probe.907.166.29
iTransformer + SupCon.877 ± .008.192.23
ArcFace.902 ± .005.174.39
PatchTST-CI + SupCon.932 ± .002.127.32
PatchTST + SupCon.935 ± .005.127.44

Honest limits. Matching holds the vehicle model fixed, not the physical vehicle; residual vehicle effects are evaluated through cross-vehicle verification in the appendix. On this page's map, model purity exceeds driver purity. Personalization gains are small (+0.8 % at 5 s).

Sources & notes
    06 · DATA & ACCESS

    Get the data, keep the rules

    No approval needed

    DriveDNA-Sample

    63 drives · 56.2 h · 14 models, same layout as the full release; gated with automatic approval.

    as of 2026-10-02 · gated: auto

    On request

    DriveDNA · full release

    ~325 GB: CAN at 10 Hz, forward video, windows, events, frozen splits and leakage probes. Research-only license, manual approval.

    as of 2026-10-02 · gated: manual · DriveDNA research license

    Open

    Code & protocol

    Baselines, splits, matching and leakage probes; reproduce every table with three-seed error bars.

    “Prohibited: re-identification attempts; insurance, employment, or law-enforcement scoring of individuals.” · “VINs, device identifiers, precise timestamps, and GPS coordinates removed.”Hugging Face dataset card · fetched 2026-10-02

    Governance. Sequential pseudonyms (driver_001 / drive_001) with the raw-ID mapping withheld by the authors; forward road video is exterior-only and low-resolution; a takedown contact lets any driver request removal.

    07 · CITE

    Read the paper, cite the benchmark

    BibTeX
    @article{wang2026drivedna,
      title   = {DriveDNA: A Large-Scale Multimodal Naturalistic Driving Dataset and Benchmark for Driving Style Identification},
      author  = {Wang, Yuhang and Li, Lingyao and Zhou, Hao},
      journal = {arXiv preprint arXiv:2607.23822},
      year    = {2026}
    }

    Related work from the lab